Reporting
One of the main usecases in Convier is going through a reporting workflow. This section will describe how to review and write a report in Convier, how to deep-dive into data analysis during the report workflow, how reports are stored and how Convier can automate certain workflow tasks in connection with other systems.
The purpose of the report is to make it as easy as possible for a user to analyse and document every necessary step in a defined analysis workflow. Examples of such workflows are Customer Due Diligence reviews or reviewing a Transaction Monitoring alert.
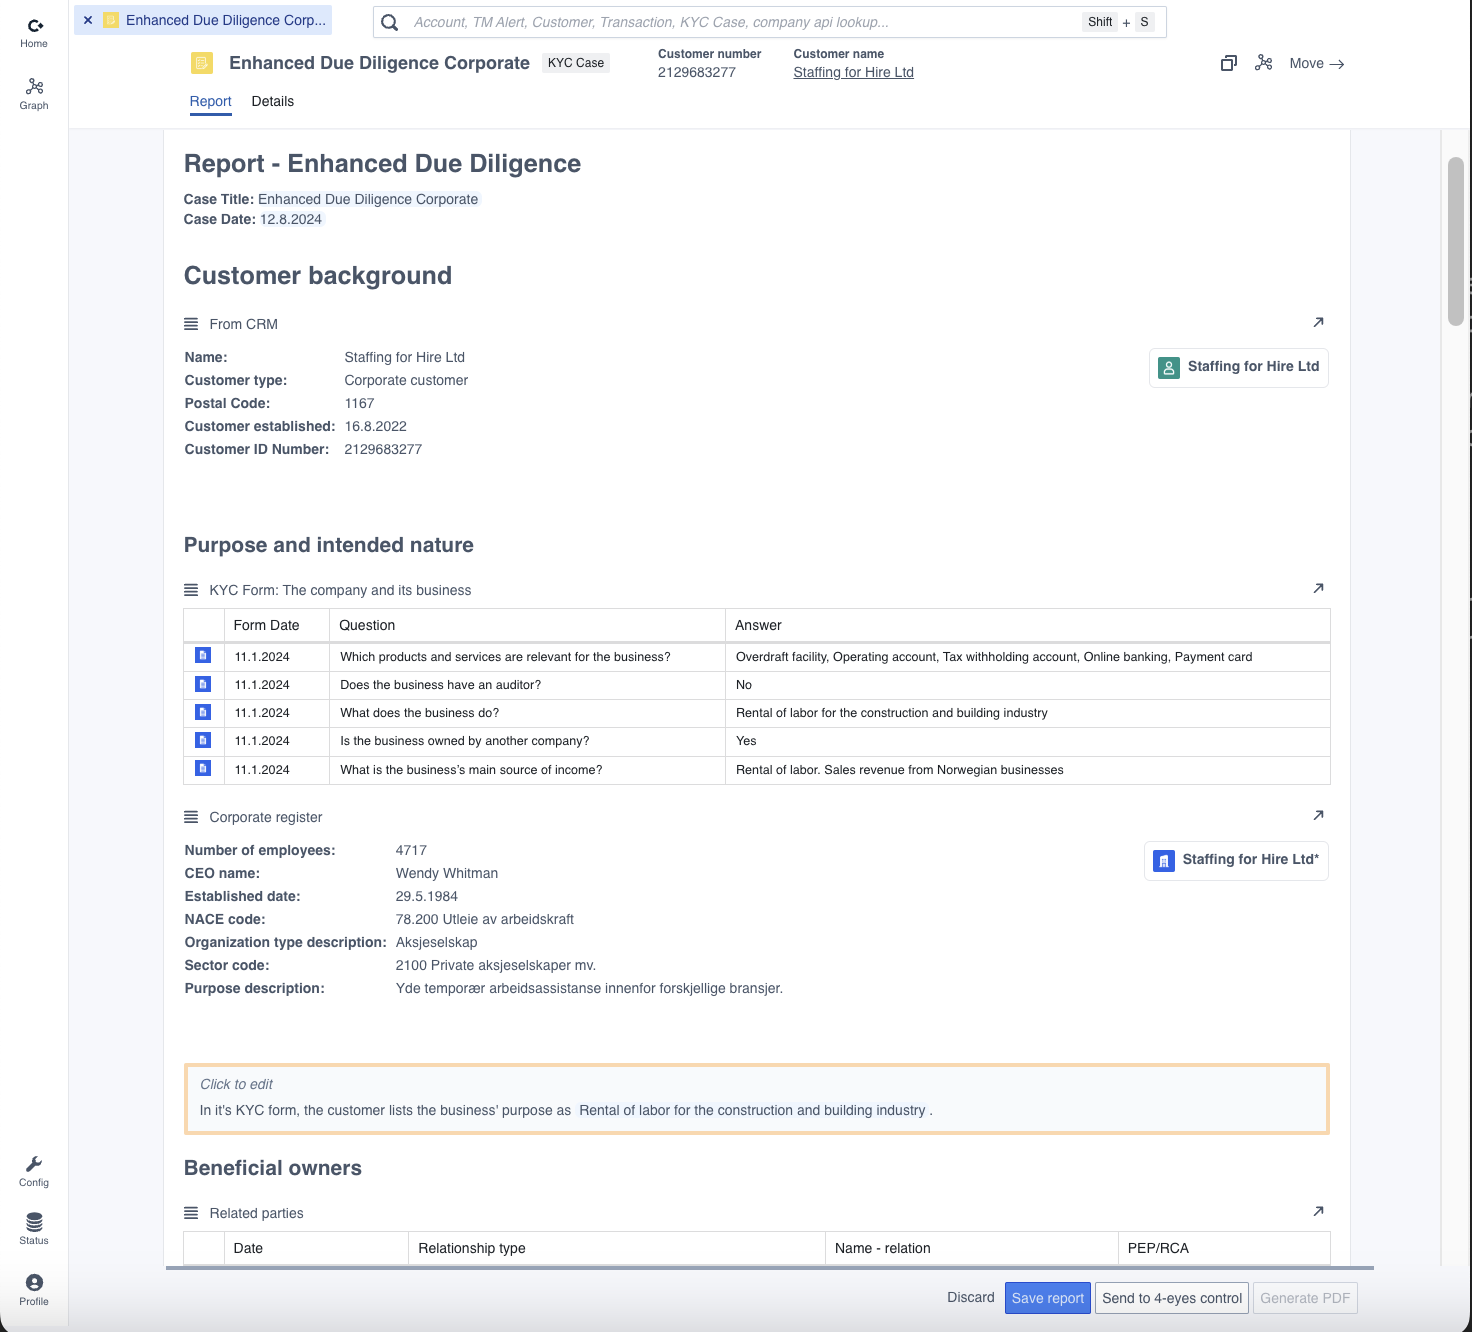 Example of a report view for an Enhanced Due Diligence report, connected to a KYC Case object
Report sections
The report view consists of sections addressing different themes or steps in the designed workflow. Each section can contain
- Template text
- Automatically retrieved data in the form of properties or charts
- User input fields
- Help texts
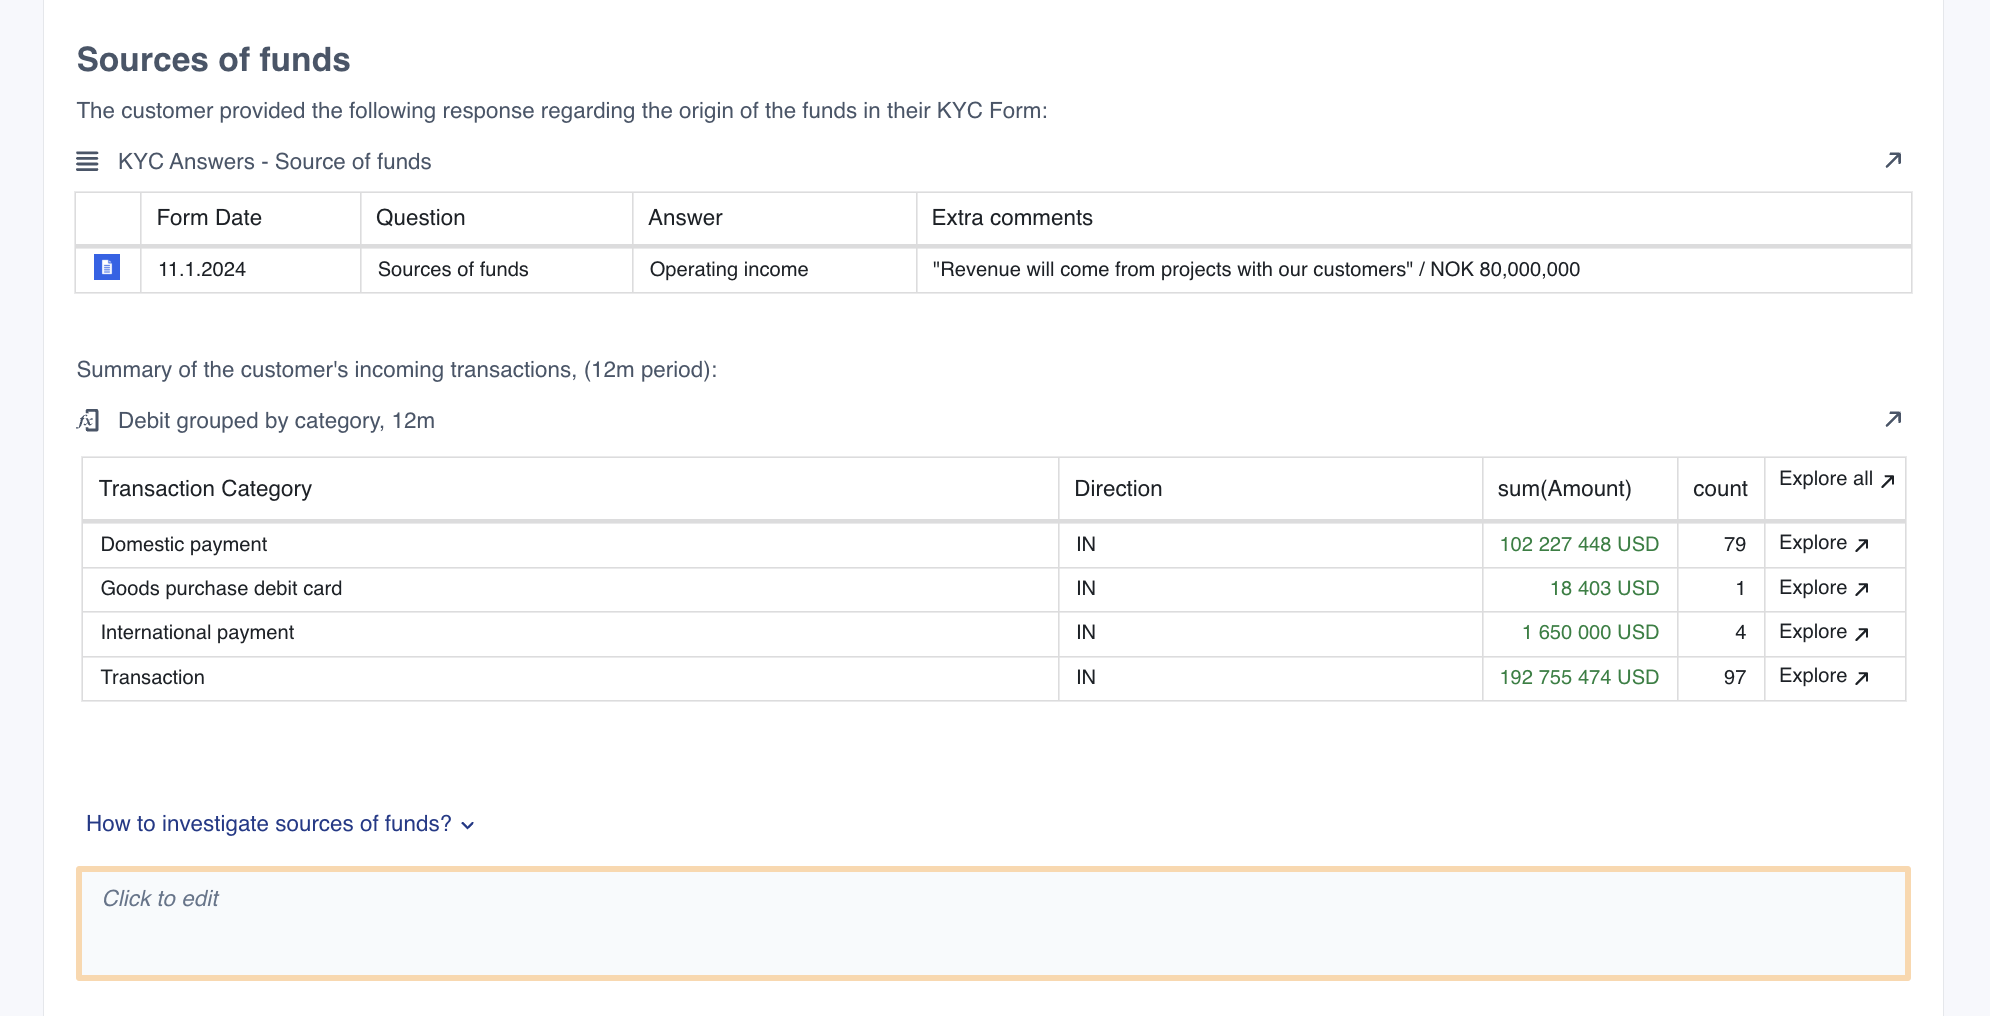 Example of a report section dedicated to documenting a customer’s sources of funds
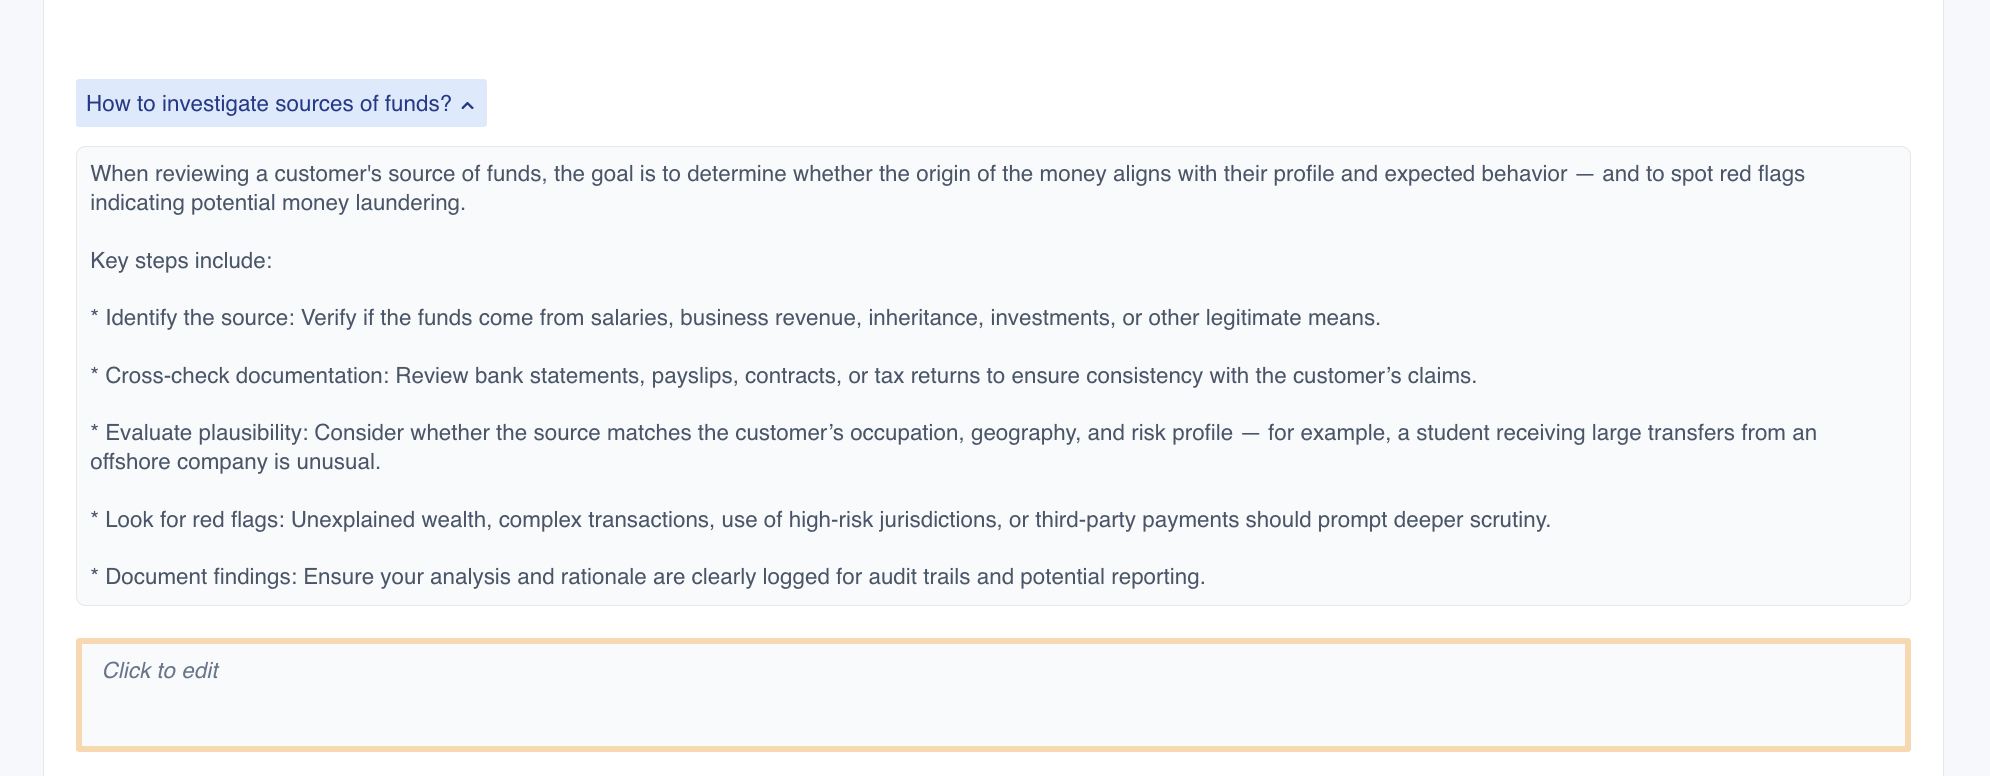 Click the helptext dropdown to see guidelines related to this report section
Select time range of the data in the report
Some of the charts in the report will contain a date selector that allows changing the date range for the data loaded in the report. Usually, the report is configured such that the time range selected for one chart will be applied to all transaction data in the report.
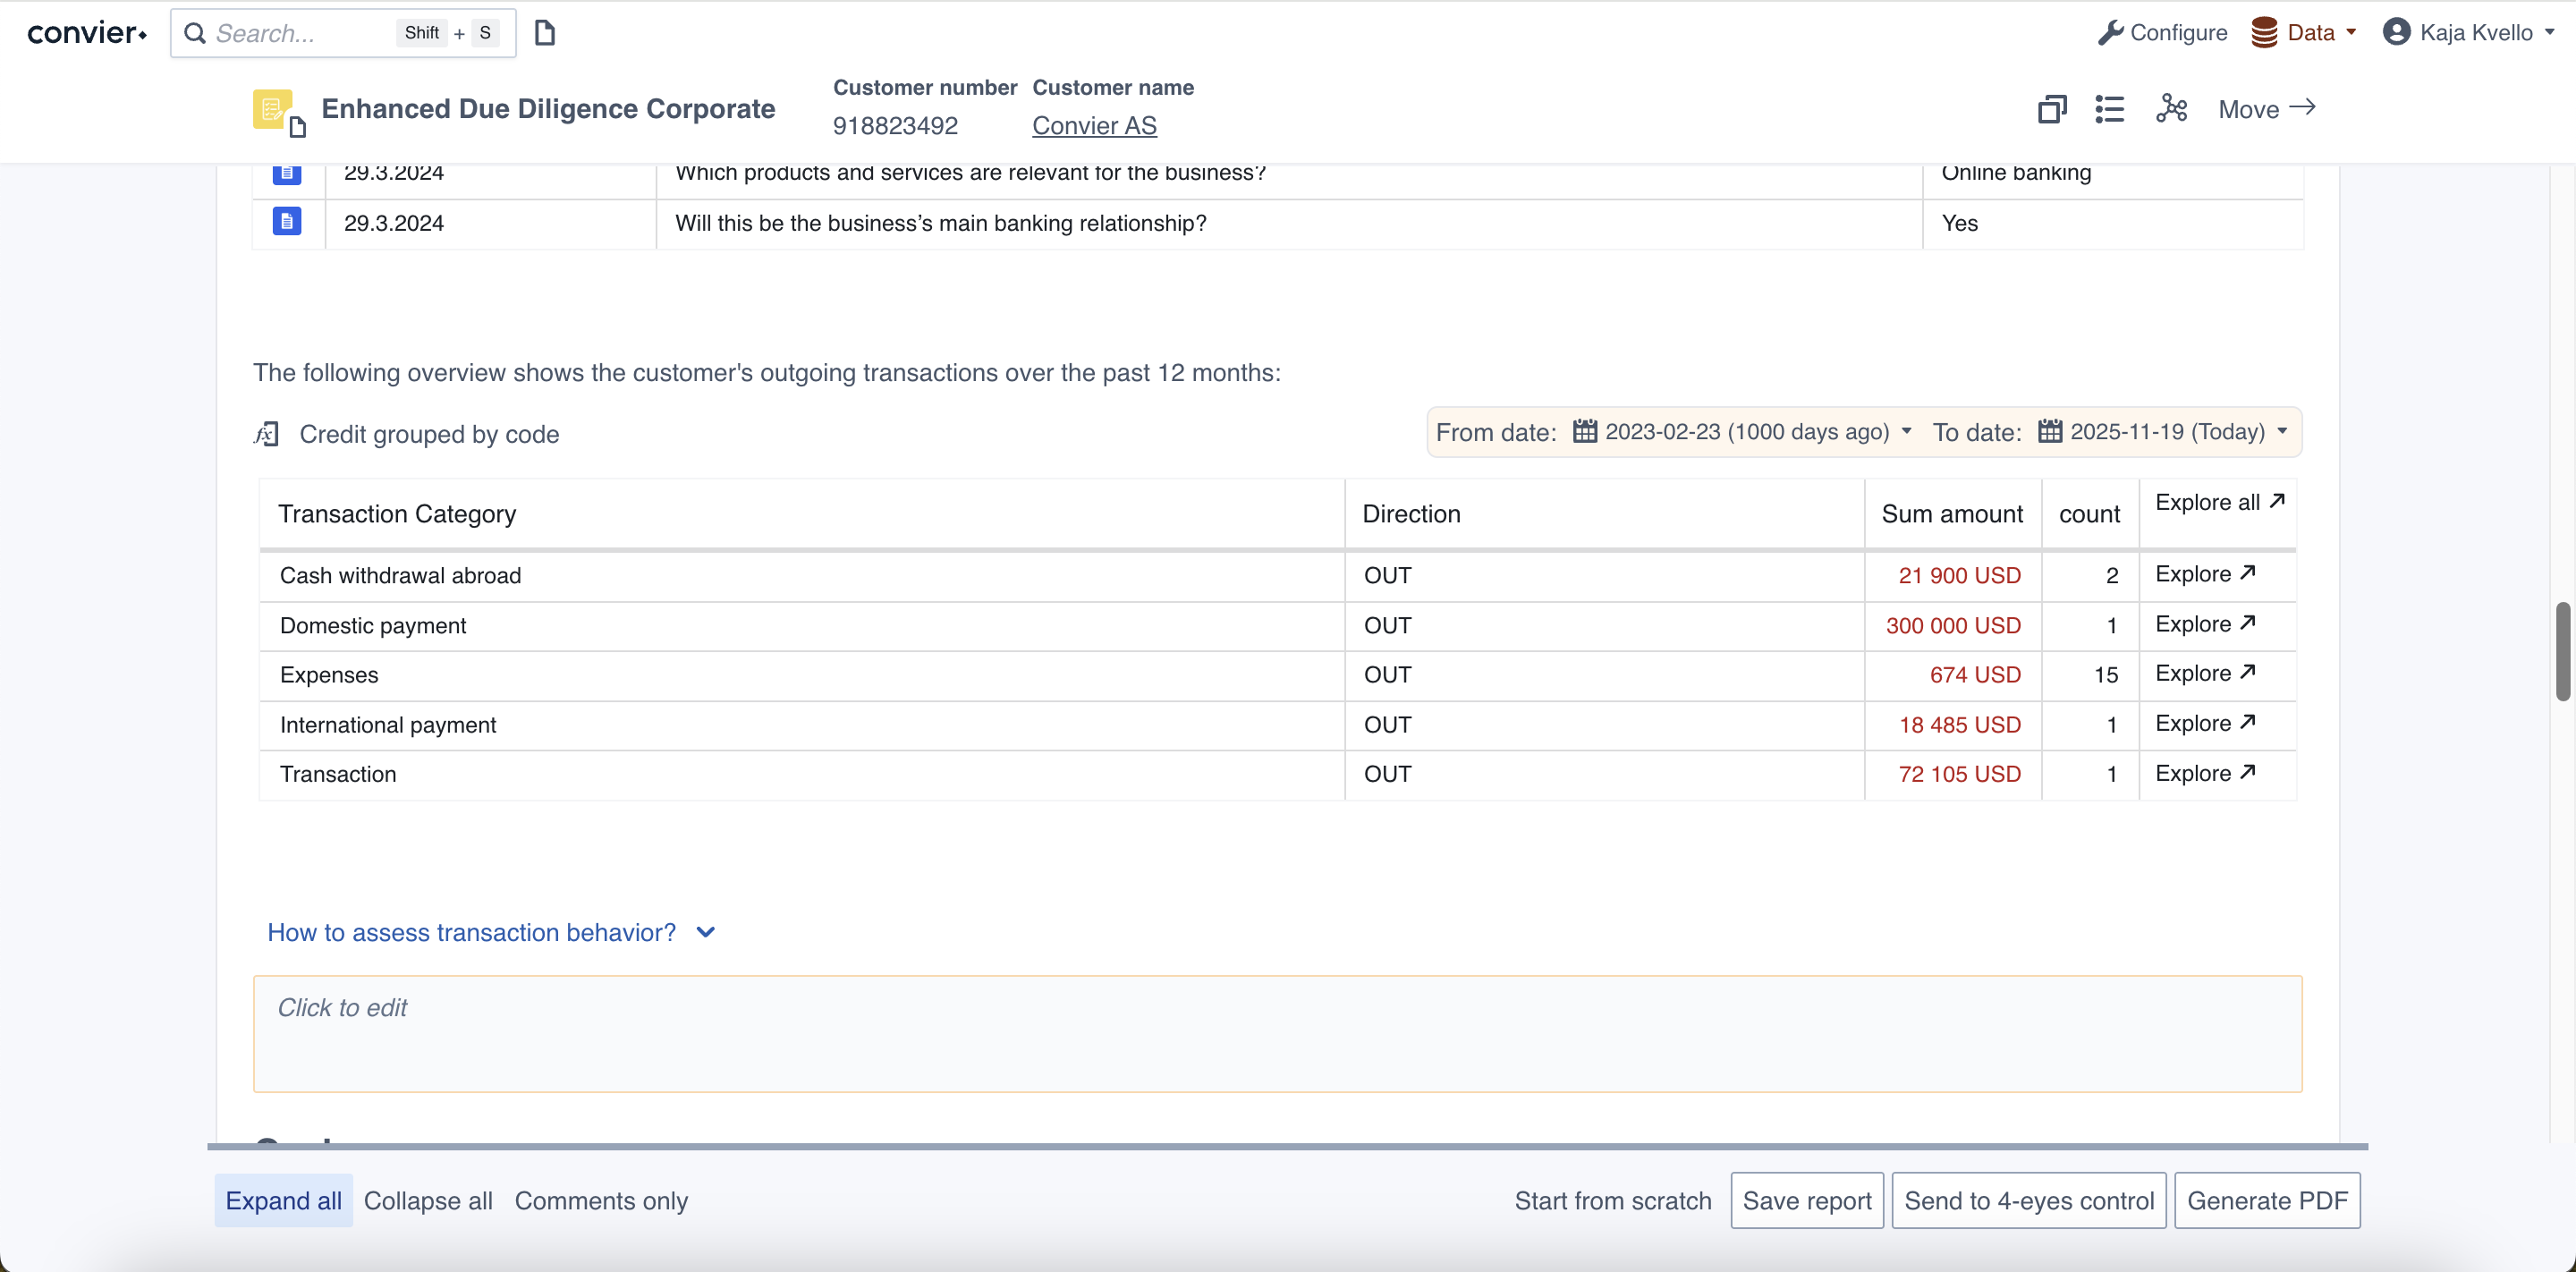 A report section containing a chart with date selector
Analysing data during a report workflow
The report view attempts to give an overview of the data that is relevant for the analysis task at hand. However, it is sometimes necessary to dive into detailed data. All charts in the report view are clickable, and can take you to a more detailed view of the data it is displaying. For instructions of how to navigate into detailed data views from each chart type, see the chart descriptions. If your screen is wide enough, all views opened from the reporting view will by default end up in the right-hand side panel. The new tab can be moved or closed as described in the navigation section.
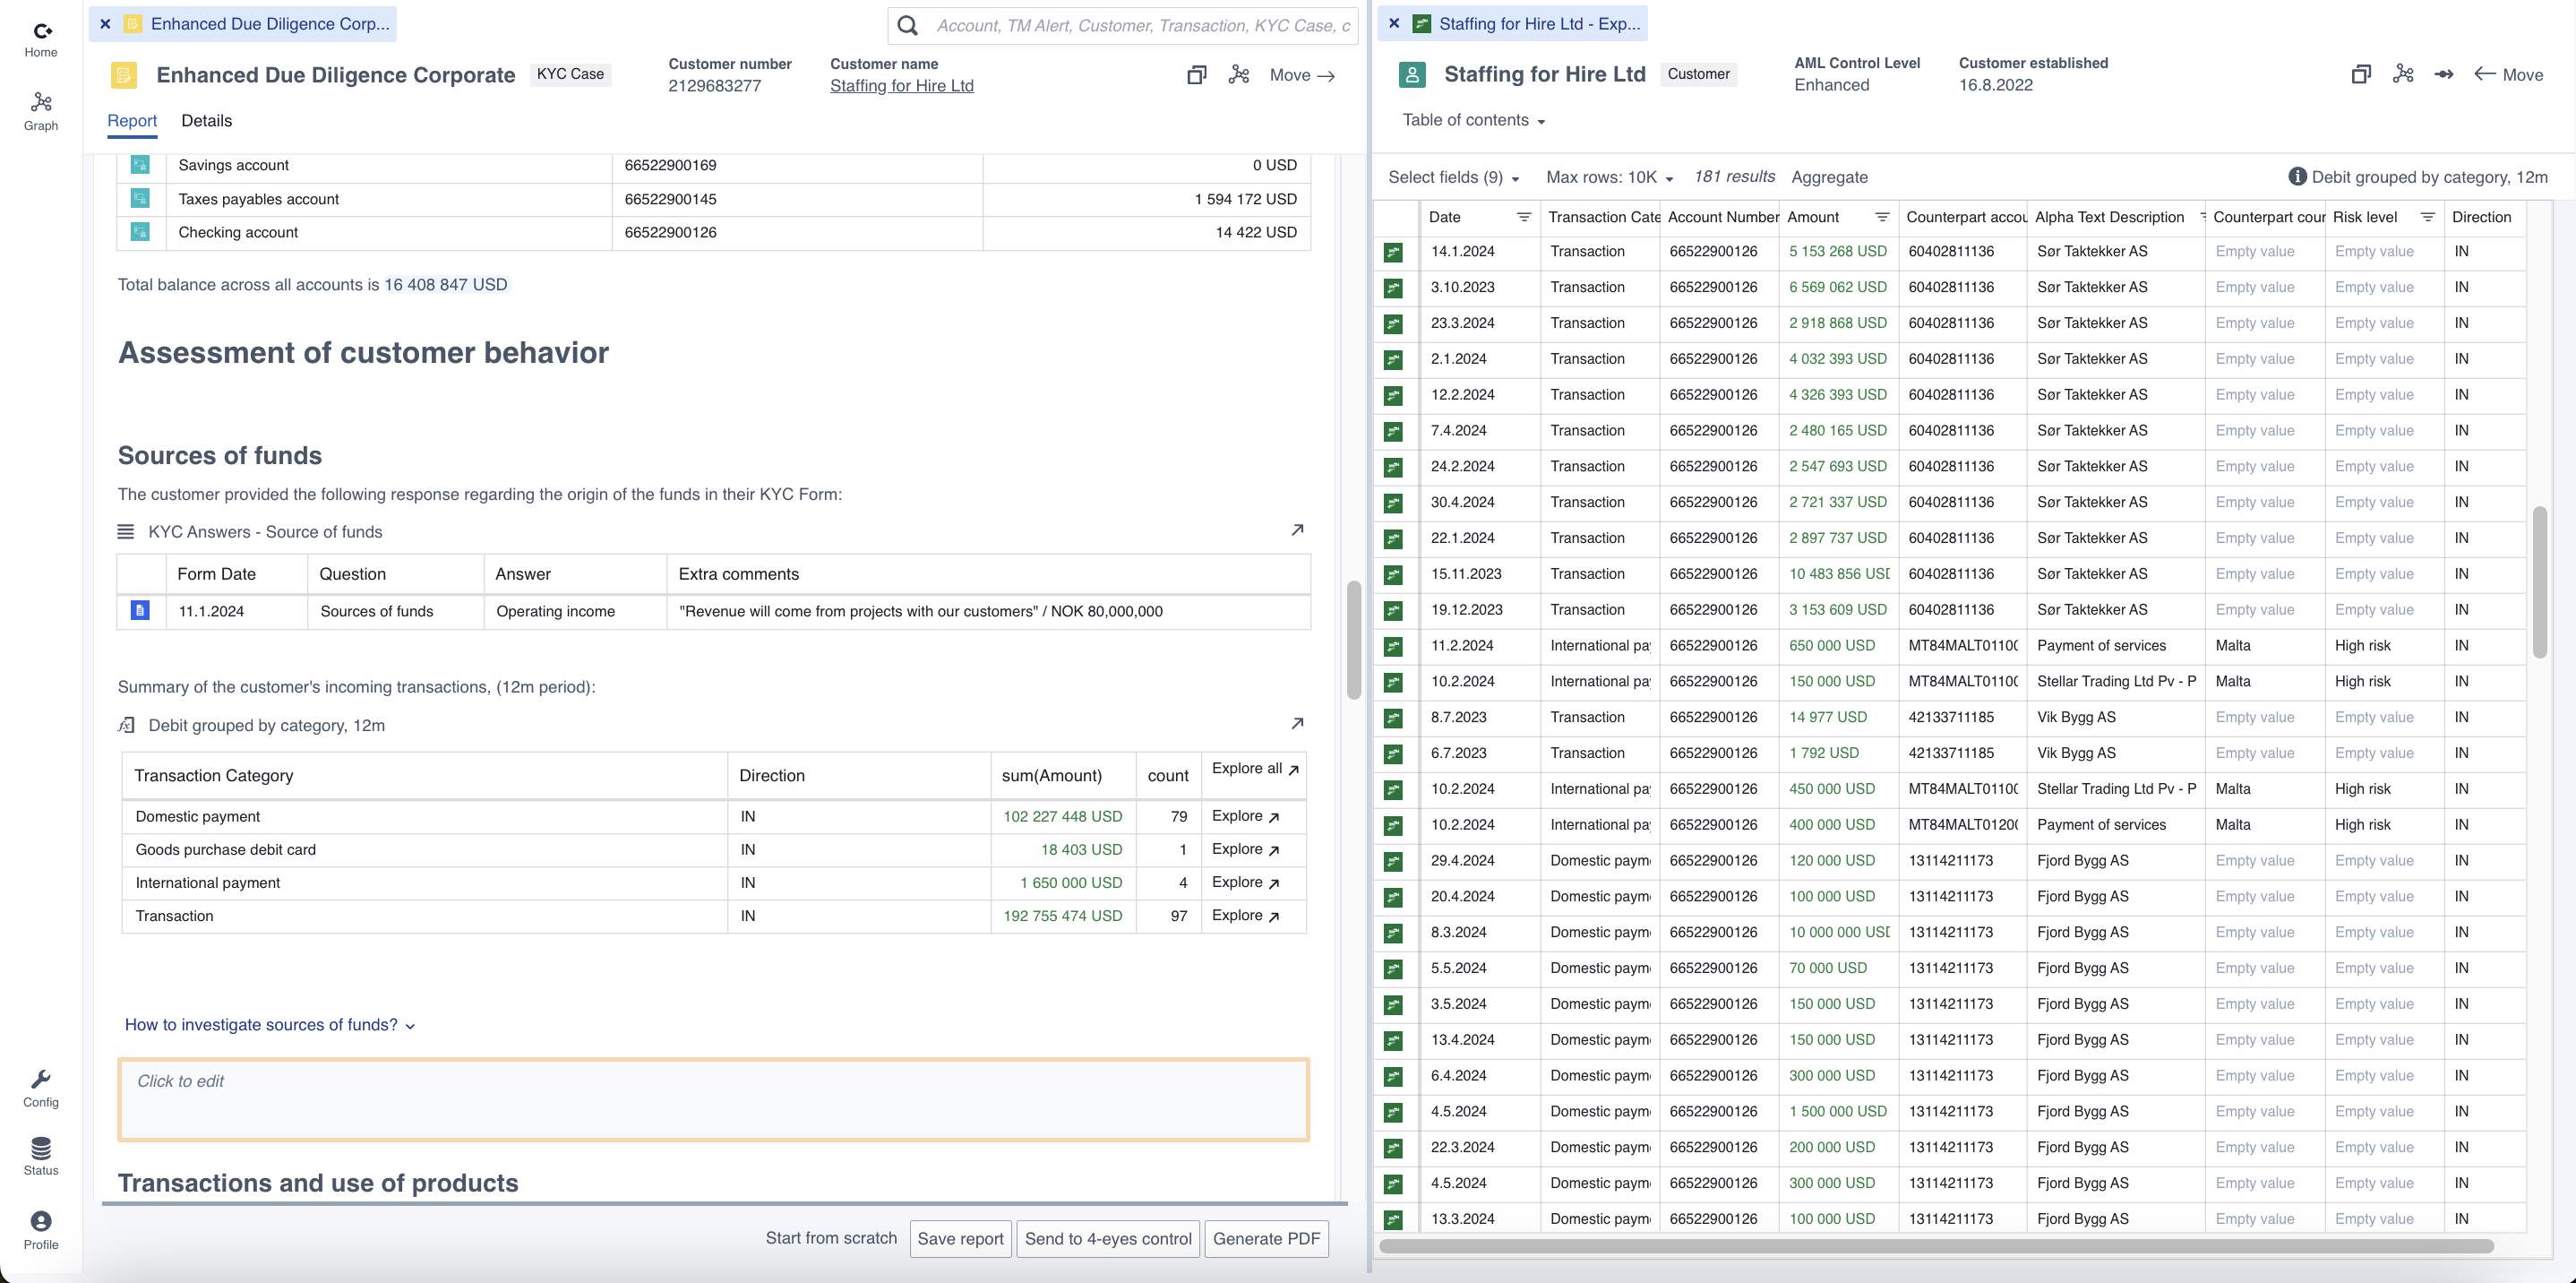 Side-by-side view of a report and a Browse view produced by clicking “Explore all” from the “Debit grouped by category”-chart in the report
Filling out a report
The report view will usually contain multiple user input fields which the analyst can use to document their findings during the analysis.
Types of user input fields
Free text input
The freetext field allows you to write any text, paste in images or screenshots or add data directly from charts. Standard keyboard shortcuts can be used while writing in an input field:
- Bold text: Ctrl + B
- Italic text: Ctrl + I
- Undo last changes: Ctrl + Z
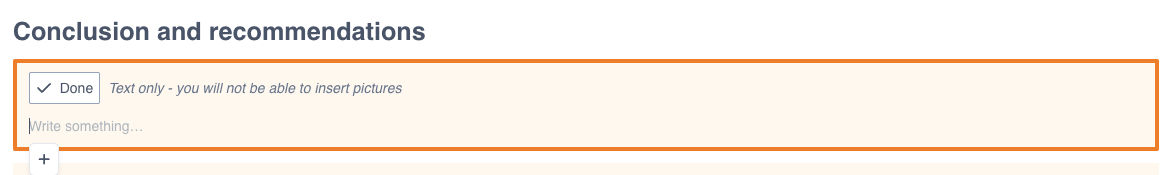
Some free text fields are configured to only accept text input, and will therefore block pasting of any images into the input field. Such input fields will display an info message when chosed as the active field.
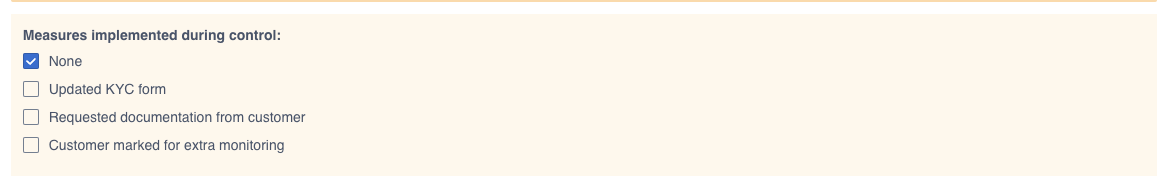
Multiselect
A multiselect input field allows the user to select bewteen several predefined choices.
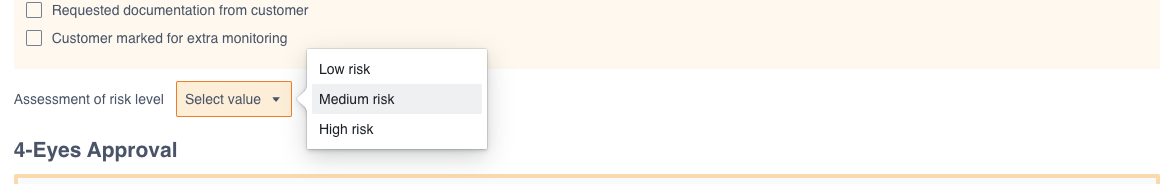
Dropdown select
The dropdown input field allows the user to select one out of several predefined choices.
Add data to report
Data from the charts and views in the platform can be added into the input fields of a report using the “Add to report”-functionality. In order to add a value into an input field, first select the input field you want to add the data into. When an input field is selected as active, an “Add to report” tooltip will start appearing when hovering the mouse over data fields in the report or charts in the platform.
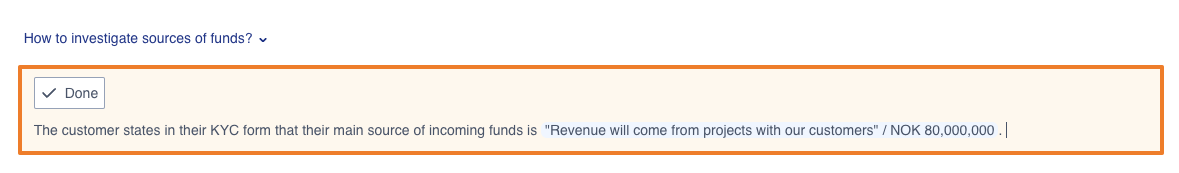
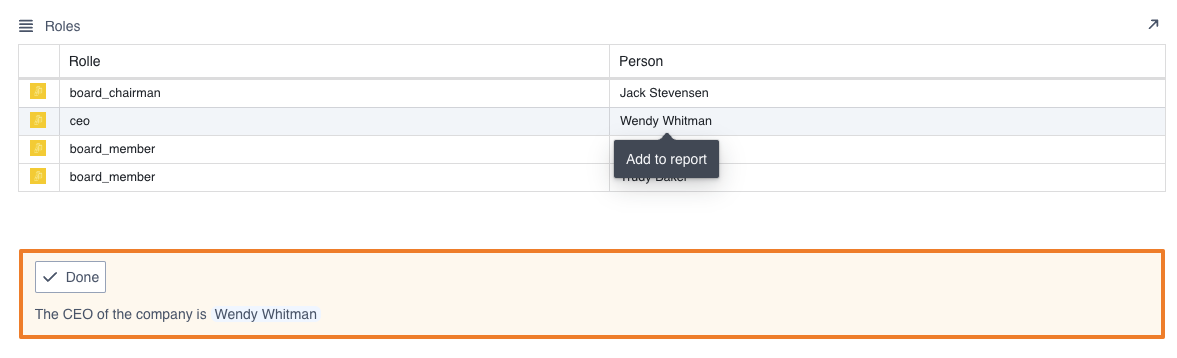 A value has been added to the input field using the “Add to report” functionality
Entire rows of data can also be brought into the input fields from the Browse view. Again, start by selecting the input field you want to add the data into. Then, mark the rows you wish to add to the report. Hold down Cmd or Ctrl to select several rows. A button marked “Add selected to report” will appear at the top of the Browse view, which can be clicked to add the selectd rows into the report.
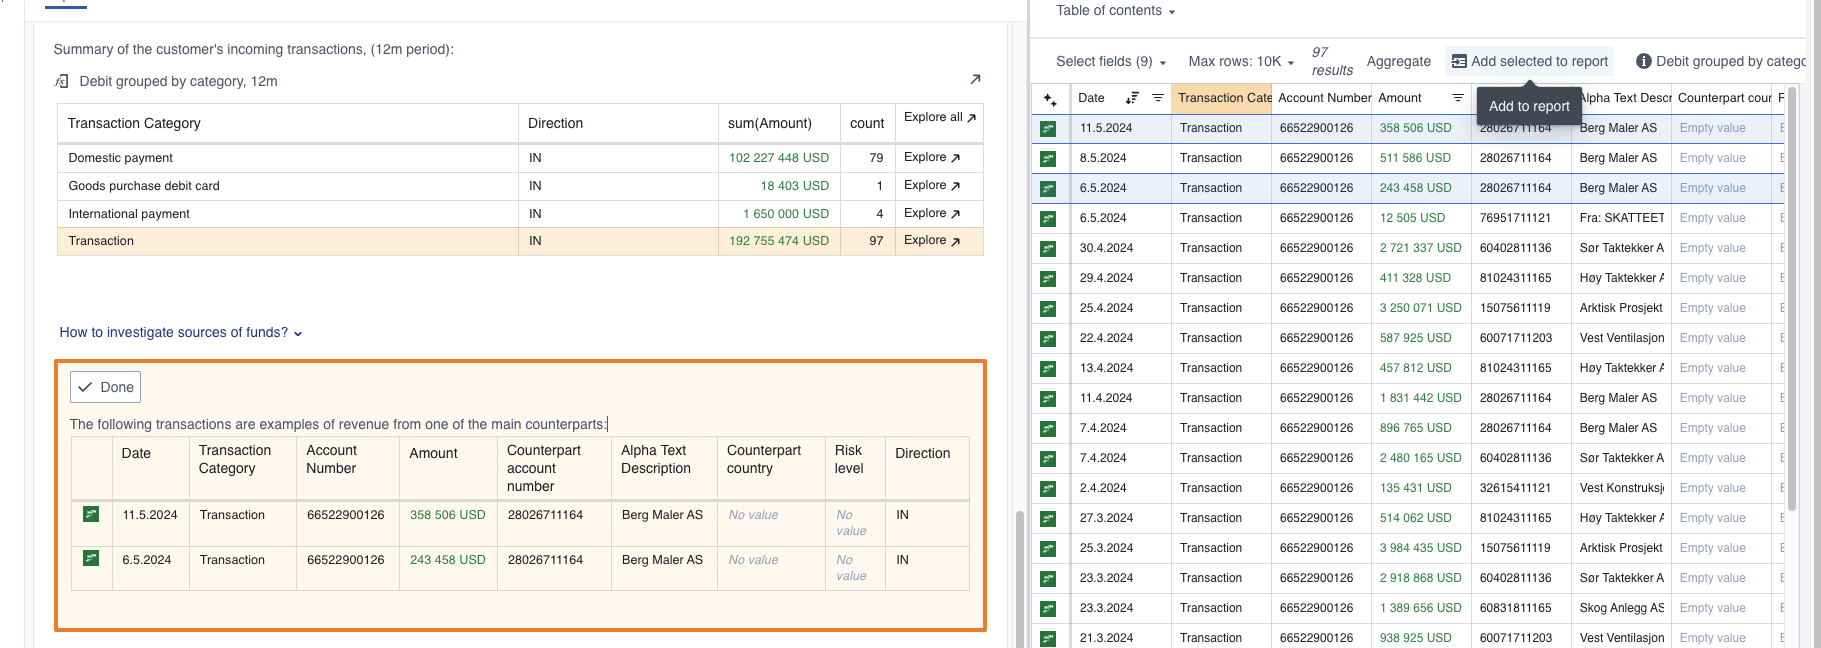 Two rows of transaction data has been added to the input field from the “Browse” view
Read-only mode
it is possible to make reports show in read-only mode when they are deemed finished, e.g. when the connected CRM-task is set as “closed”. All input-fields in the report will be locked and impossible to edit in read-only mode. To “re-open” the report and continue editing it, the trigger value for the read-only mode must be changed. This can usually be achieved by reopening the connected case in the CRM-system (depending on the Convier setup in your organisation).
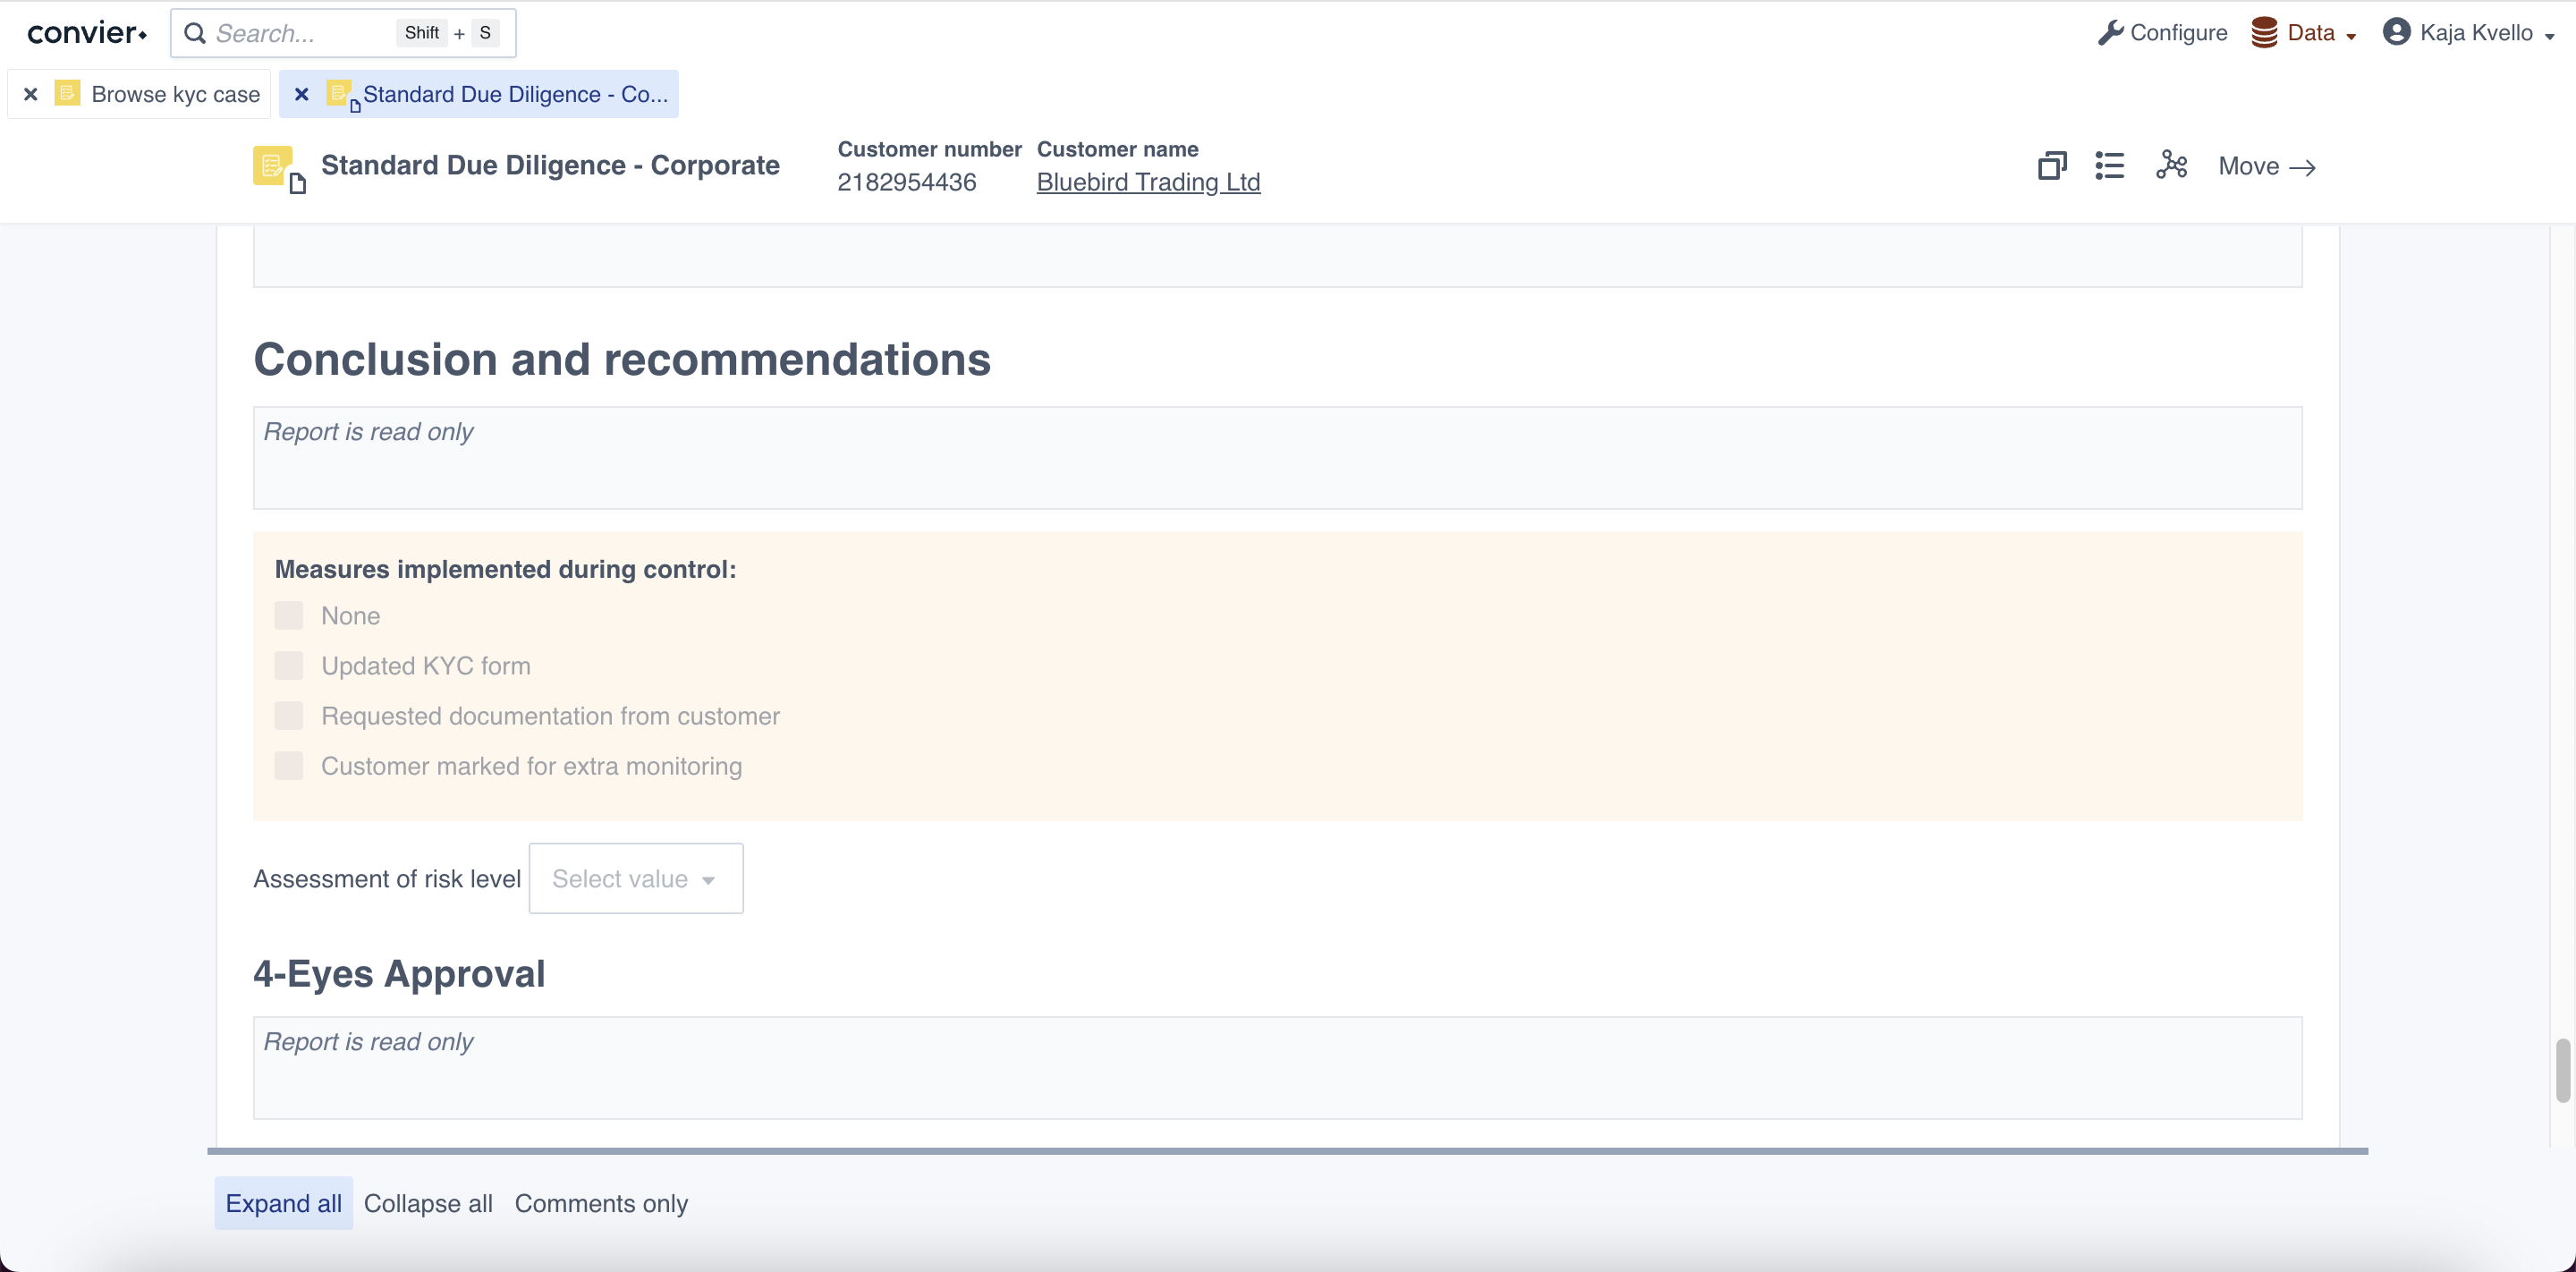 Example of a report in read-only mode
Collapse report sections
When reviewing a report it might be helpful to see only the most relevant report sections. This can be achieved by using the collapse functionality in the report view. There are 3 buttons in the bottom part of the report view which allows the user to select the desired view mode for the report.
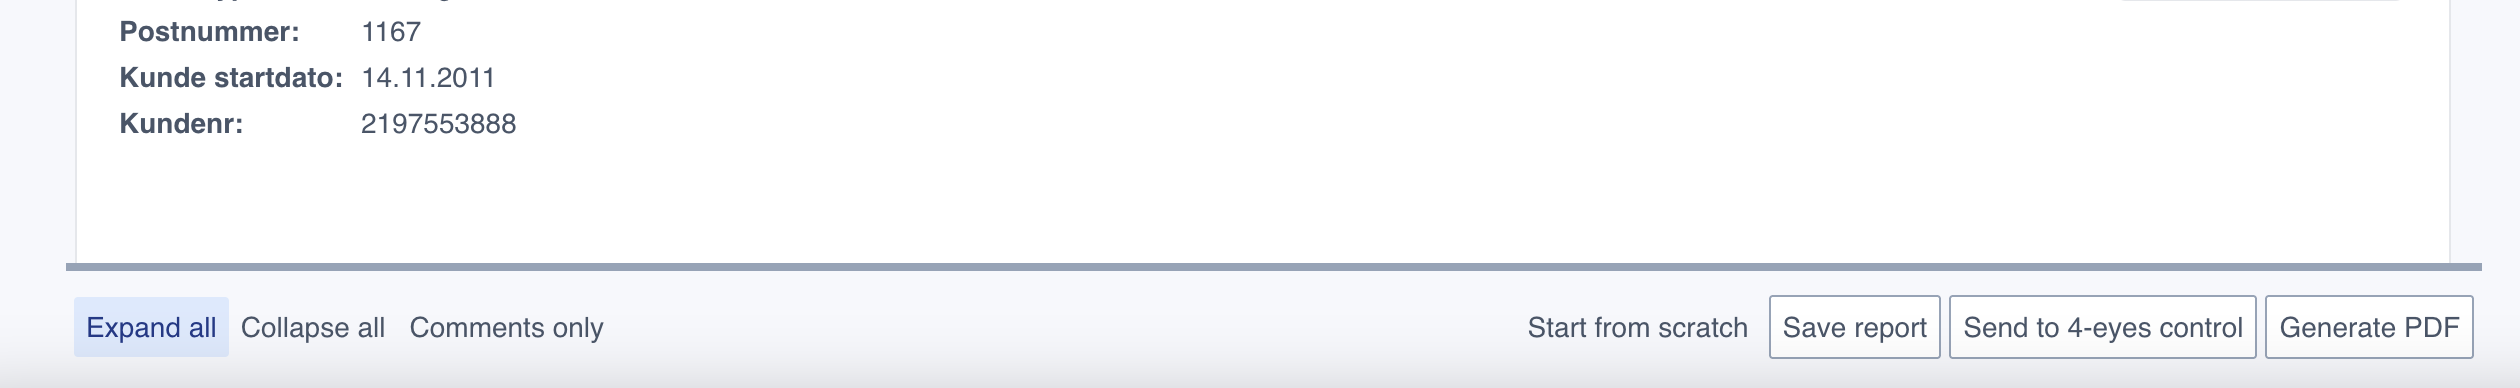
- “Expand all” expands and displays all sections of the report, including all data and input fields (default mode)
- “Collapse all” will collapse all sections. Click the arrows next to a section heading to expand or collapse that section.
- “Comments only” will hide all automatically retrieved data in all sections, and show only the input fields. This mode is helpful when reviewing all comments before submitting or closing a report.
 A report in “collapse all” view mode, with one section expanded. Click the arrows next to a section heading to expand/collapse
Storing reports and report data
Report data is stored in the following way:
Working storage in the browser
As a user is editing a report, the contents written in the input fields will be temporarilly stored in the user’s local browser. This means that if a report is closed and then re-opened by the same user, the contents written in the input fields will still be there. However, another user opening the same report will not see and content in the input fields. If the local browser data of the user is deleted (f.ex. due to an upgrade), the written report content will also be deleted. It is therefore advised to properly save a report before closing it.
Saving a report
The “Save” button will store the current report to the report store configured for the project in question. The report store is usually a dedicated database for report data, but can also be a CRM system or other store location. When a report is stored, both the contents of the input fields and the loaded data is saved. This means that a stored report will load the report data with the values they had at the time the report was saved for the first time. The timestamp at the top of the report contains information about what time the report data is loaded from. Saved reports will not automatically update it’s data.
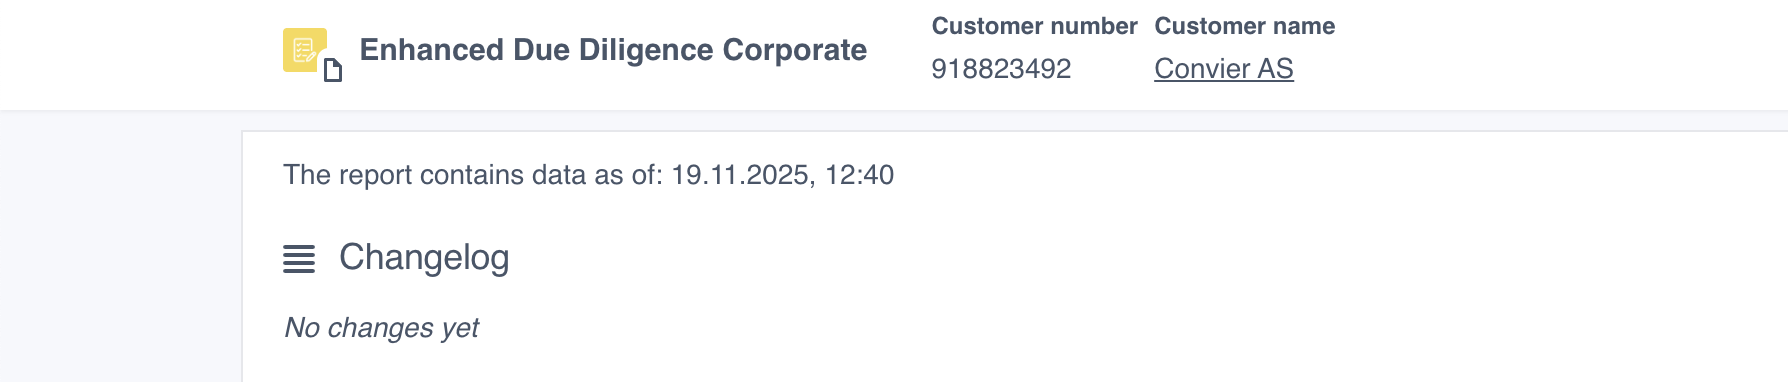 The timestamp indicated the time for when the data in the report was loaded