Analysing data
Convier has functionality for exploring and analysing data in different ways, depending on the usecase.
Select date range for data views
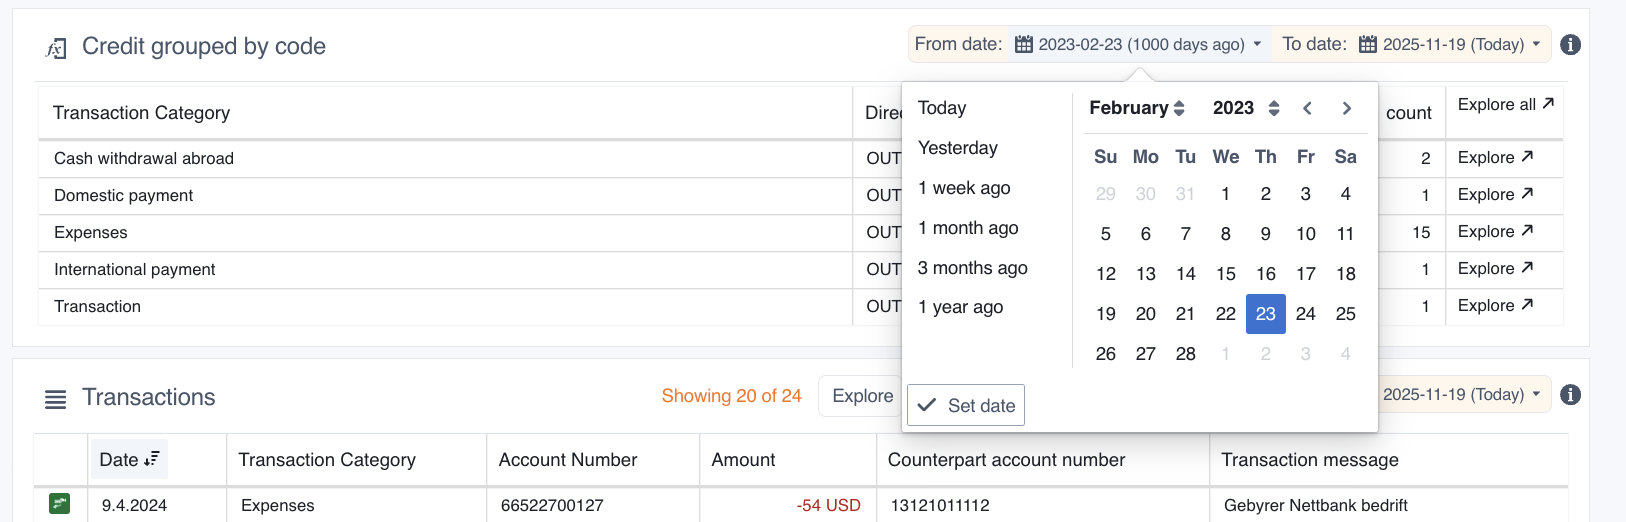
Certain charts and browse views in Convier will contain a date selector indicating the time range of the data it contains. Change the time range of loaded data by selecting a new date for the “from/to date” field. Note that chaging the date in one chart or view will affect the selected date range in other views in the platform.
Browse data
Browse is a functionality which allows you to explore, filter and sort data in a table view. You can select what data to view in Browse mode by clicking the “Explore” buttons of a chart that contains the data you wish to analyse.
Choose values and data size
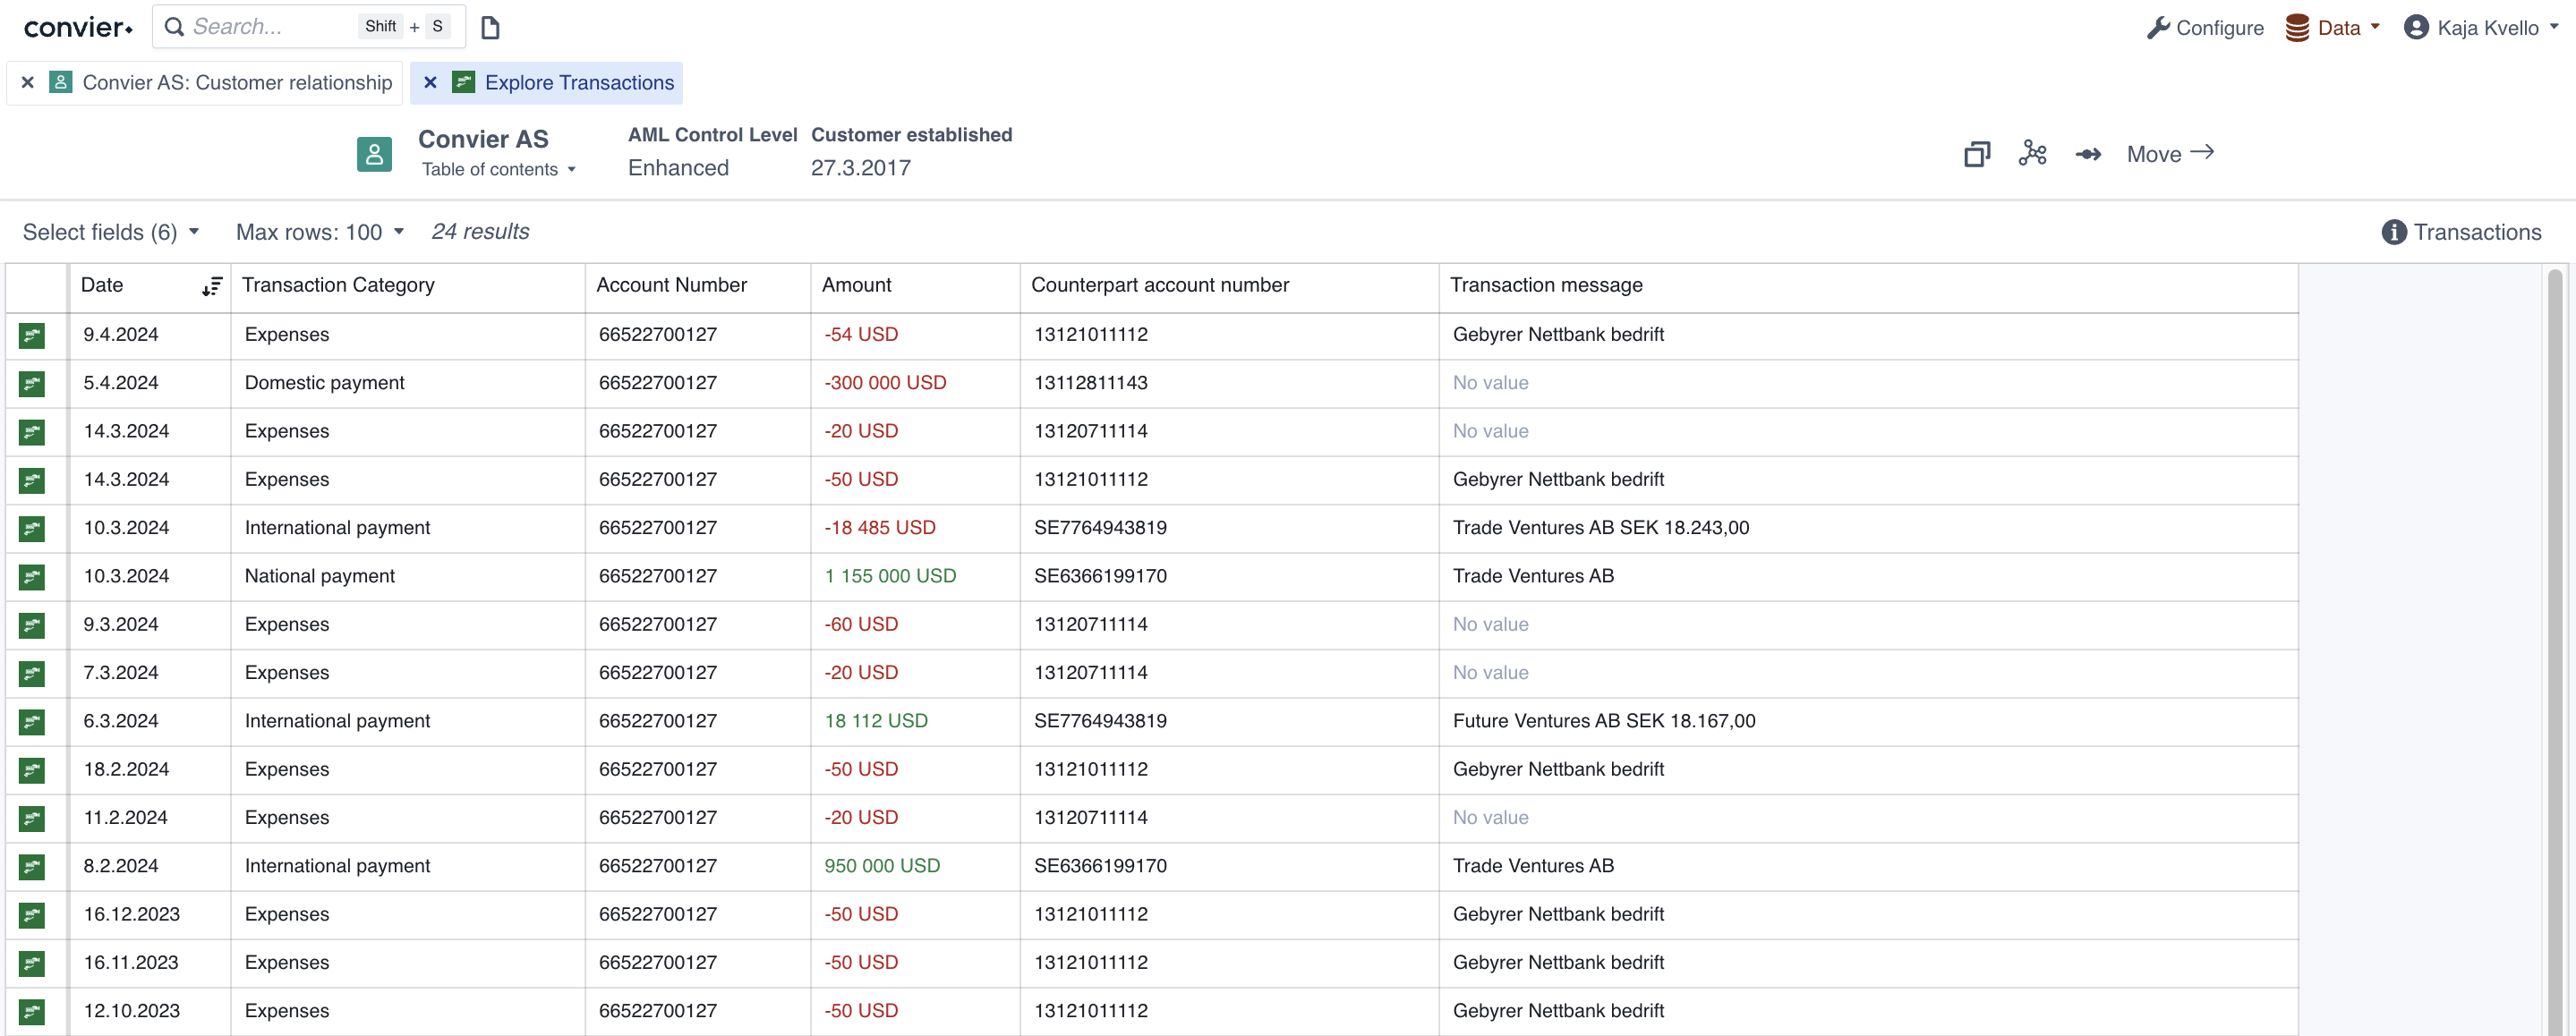
The top bar of the Browse view contains options for what, and how much, data to load into the Browse view. “Max rows” decides the maximum number of rows to load in from the data source. Be advised that loading a large number of rows might be slow. The top bar will also contain information about how many rows have been loaded into the current view.
“Select fields” allow selecting or un-selecting the columns displayed in the view.
Sorting data
Data in a table can be sorted by clicking the column header of the column you want to sort by. Clicking once will sort the data in ascending direction, clicking twice will sort in a descending direction. The sorting icon indicates which direction and column the table is currectly sorted by.
Filtering data
To filter the data in the Browse view, click the “Filter”-button in the column you wish to filter by. The filter dropdown will give several options for how to filter the table data. Add the desired filter(s) and click “Apply” to display the resulting rows in the Browse view. Columns with an active filter will be highlighted in yellow. To clear the filter in a column, click “Clear” in the filter dropdown.
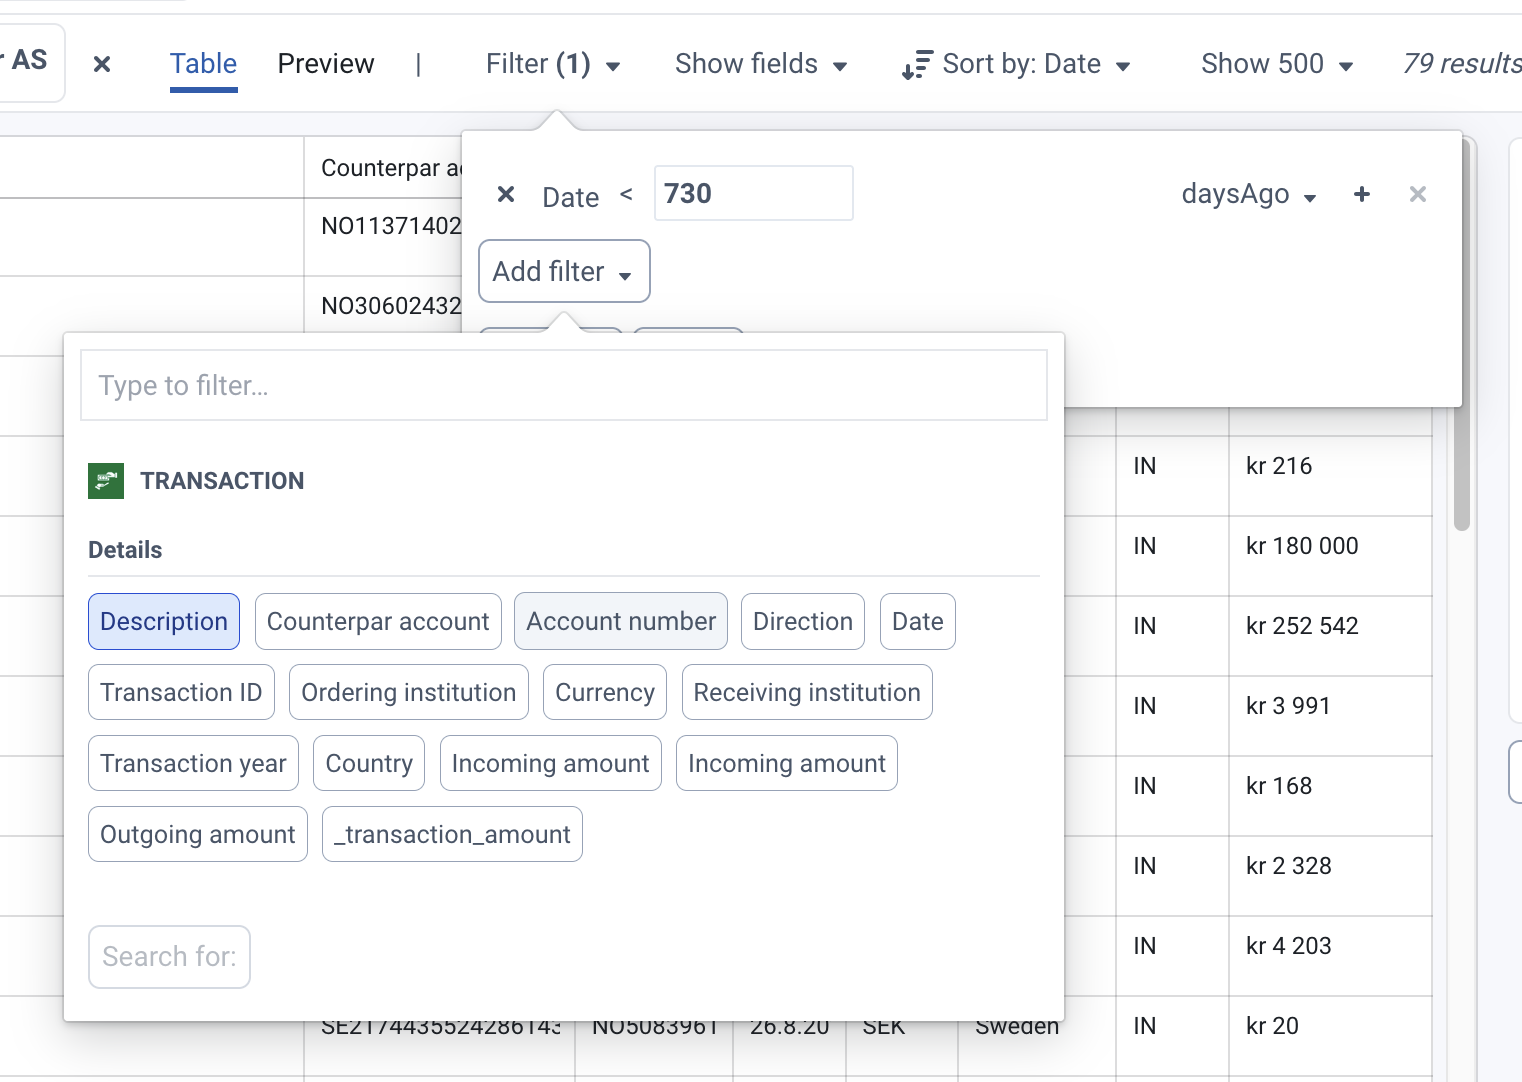 Filter about to be applied on the column “Transaction Category”, showing only transactions with category “Cash withdrawal abroad” or “International payment”
The filter options available:
- “Add filter” will compare the value in the selected column to a chosen filter value. The filter type can also be adjusted (e.g. from “equals” to “not equals”). Click the “+”-button behind the filter to filter on several filter values. Click the example values in the right-hand list to quick-add these as filter values.
- “Has value” will display only the rows where this column has a value
- “No value” will display only the columns where this column is empty
Group data
It is also possible to group data by a specific column, similar to how a pivot table works in Excel. To group the data, select “Group by” on the column value you want to group by. It is possible to select “Group by” on several columns to further divide into subgroups. To add sums of values in the grouping table, select “Sum” on the column you want to add the sum of. To see only the rows included in one group, use the Explore-button (arrow) on the desired group row. This will filter the Browse view to only include rows in the given group.
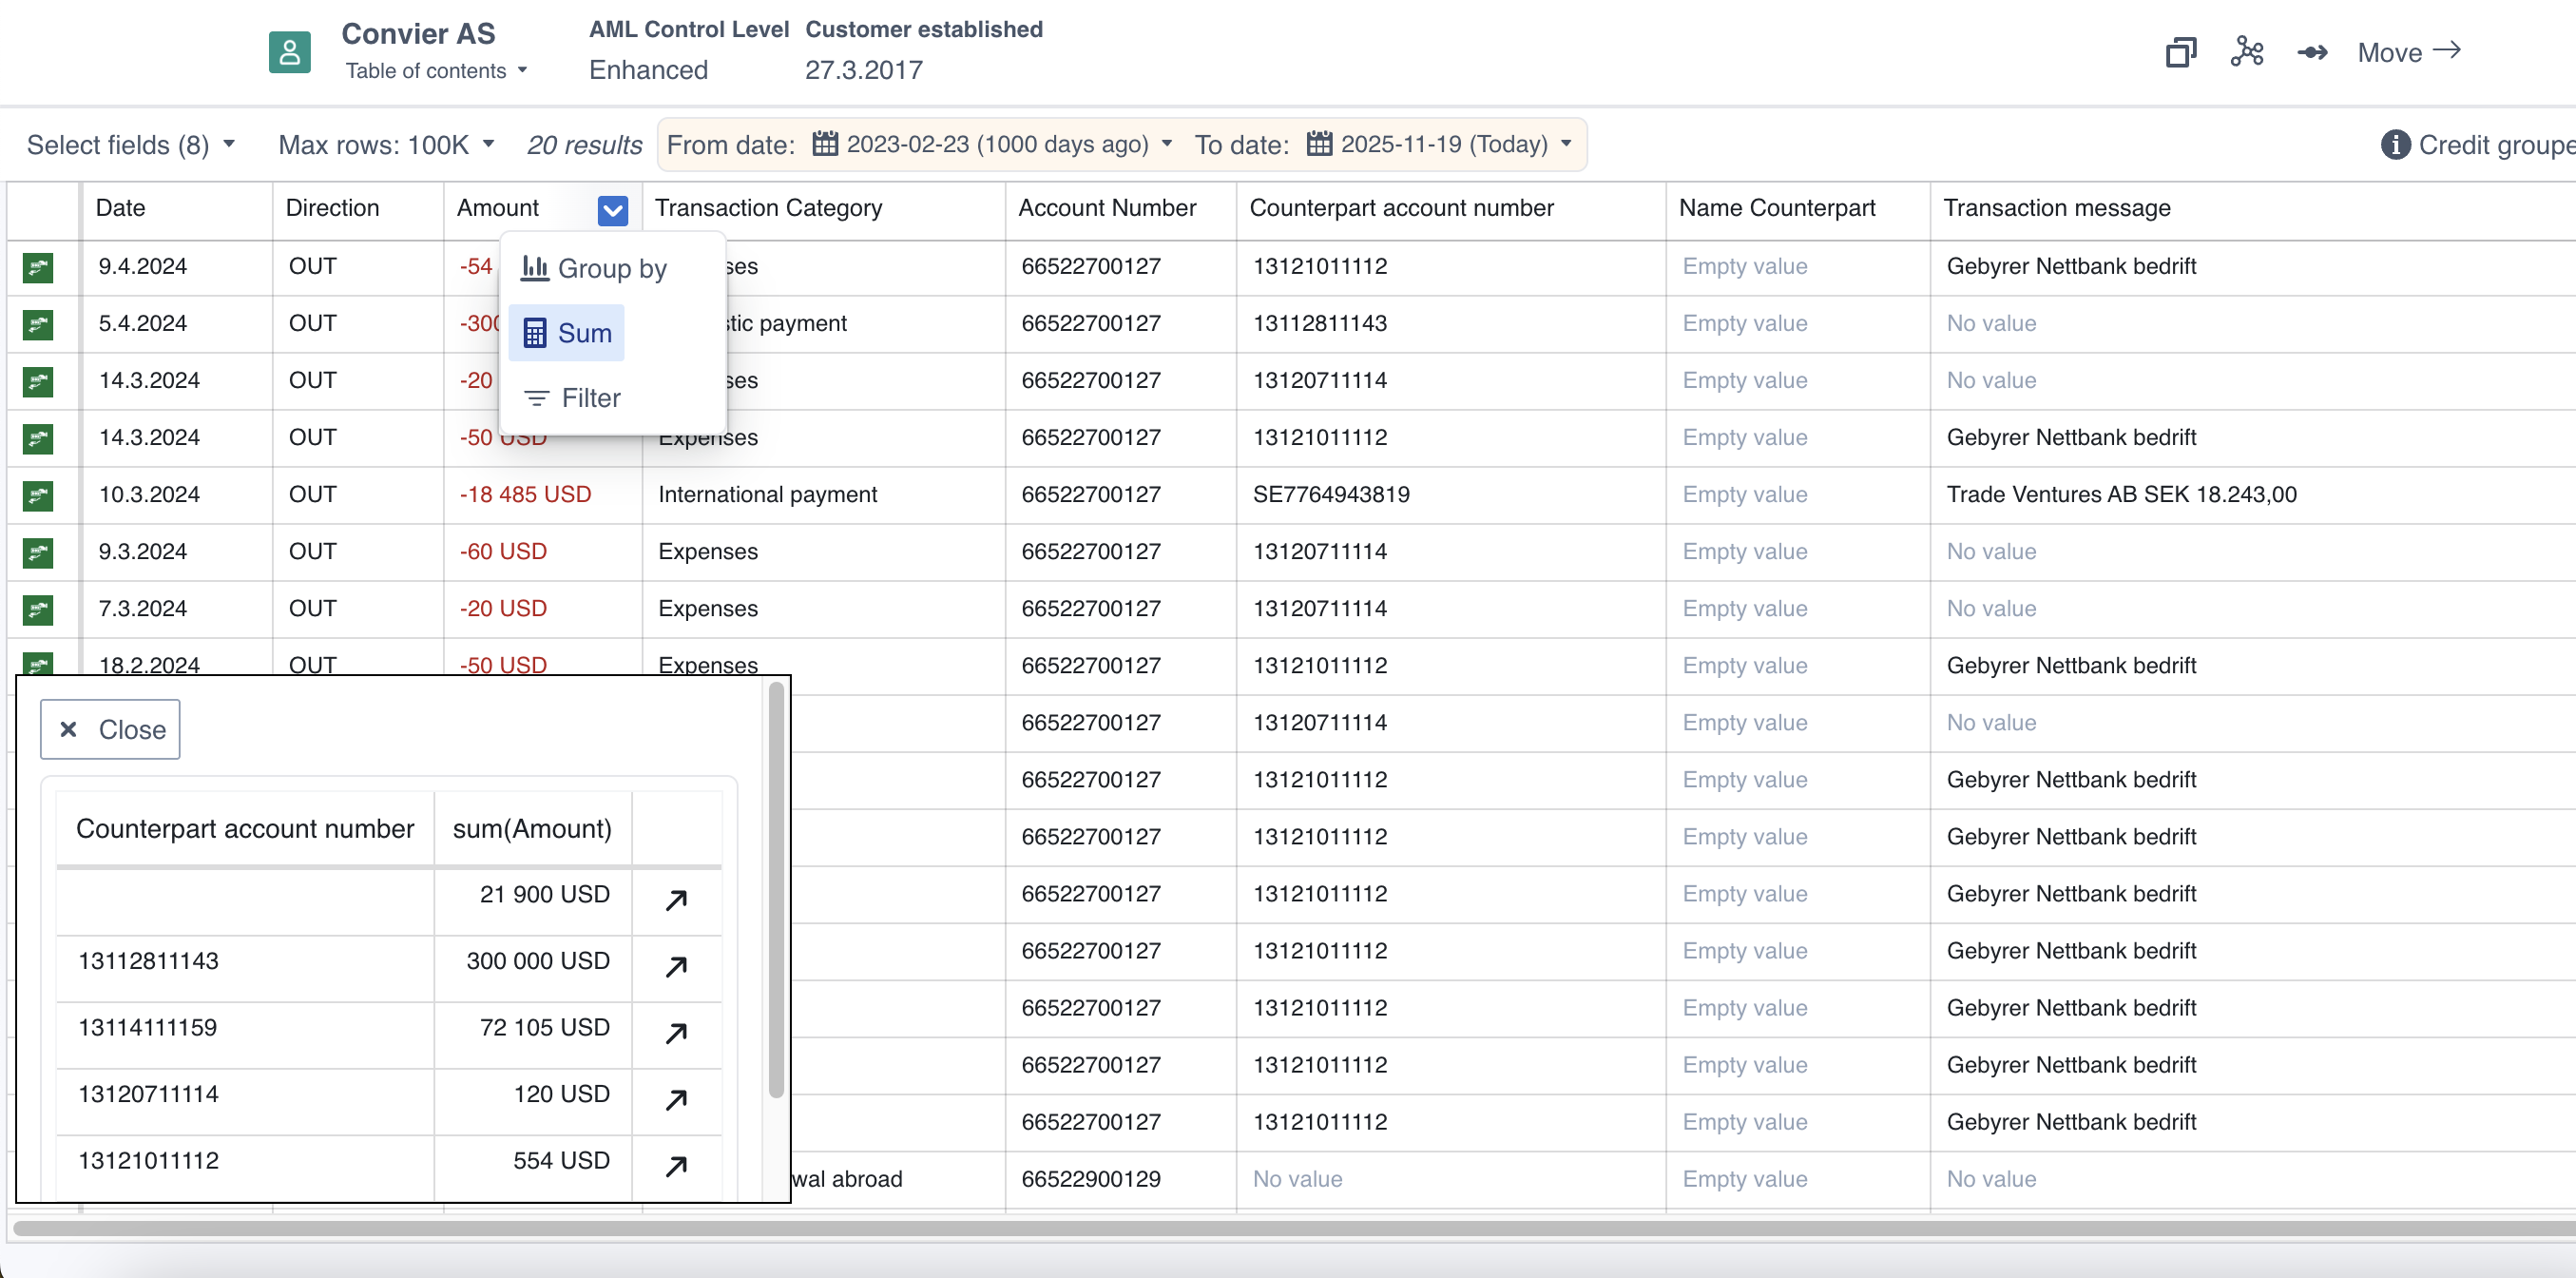 A transaction list grouped by “Counterpart account number”, with a sum of “Amount” added to the table