Chart types
The different chart types allows users to visualize their data in various ways. Here is an overview of the avaliable types of chart visualizations:
Object list
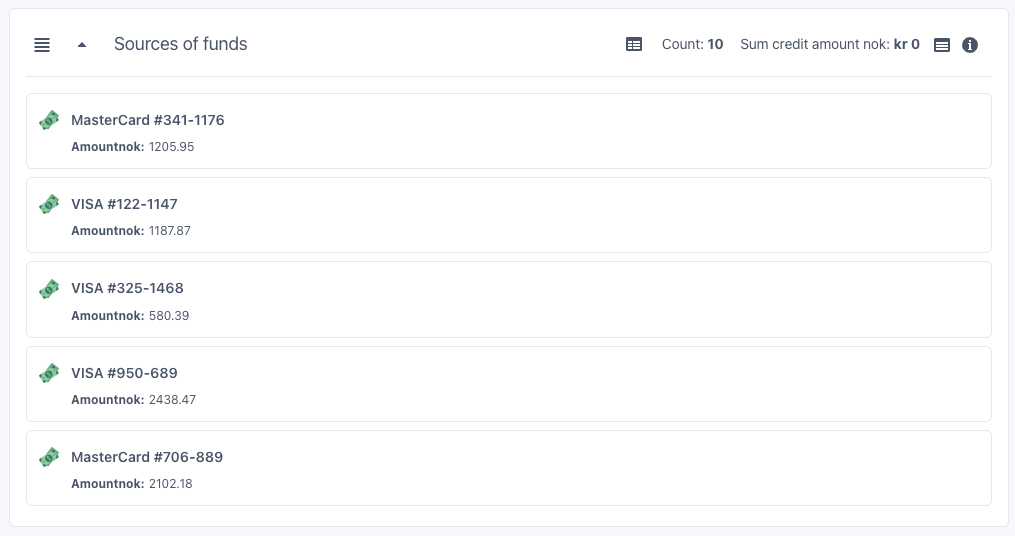
An object list is a clickable list of objects that are somehow related to the currently viewed object. The list can display objects based on simple or complex searches traversing the links between objects. It is also possible to configure a filter to narrow down the results displayed in the list.
Object comparison
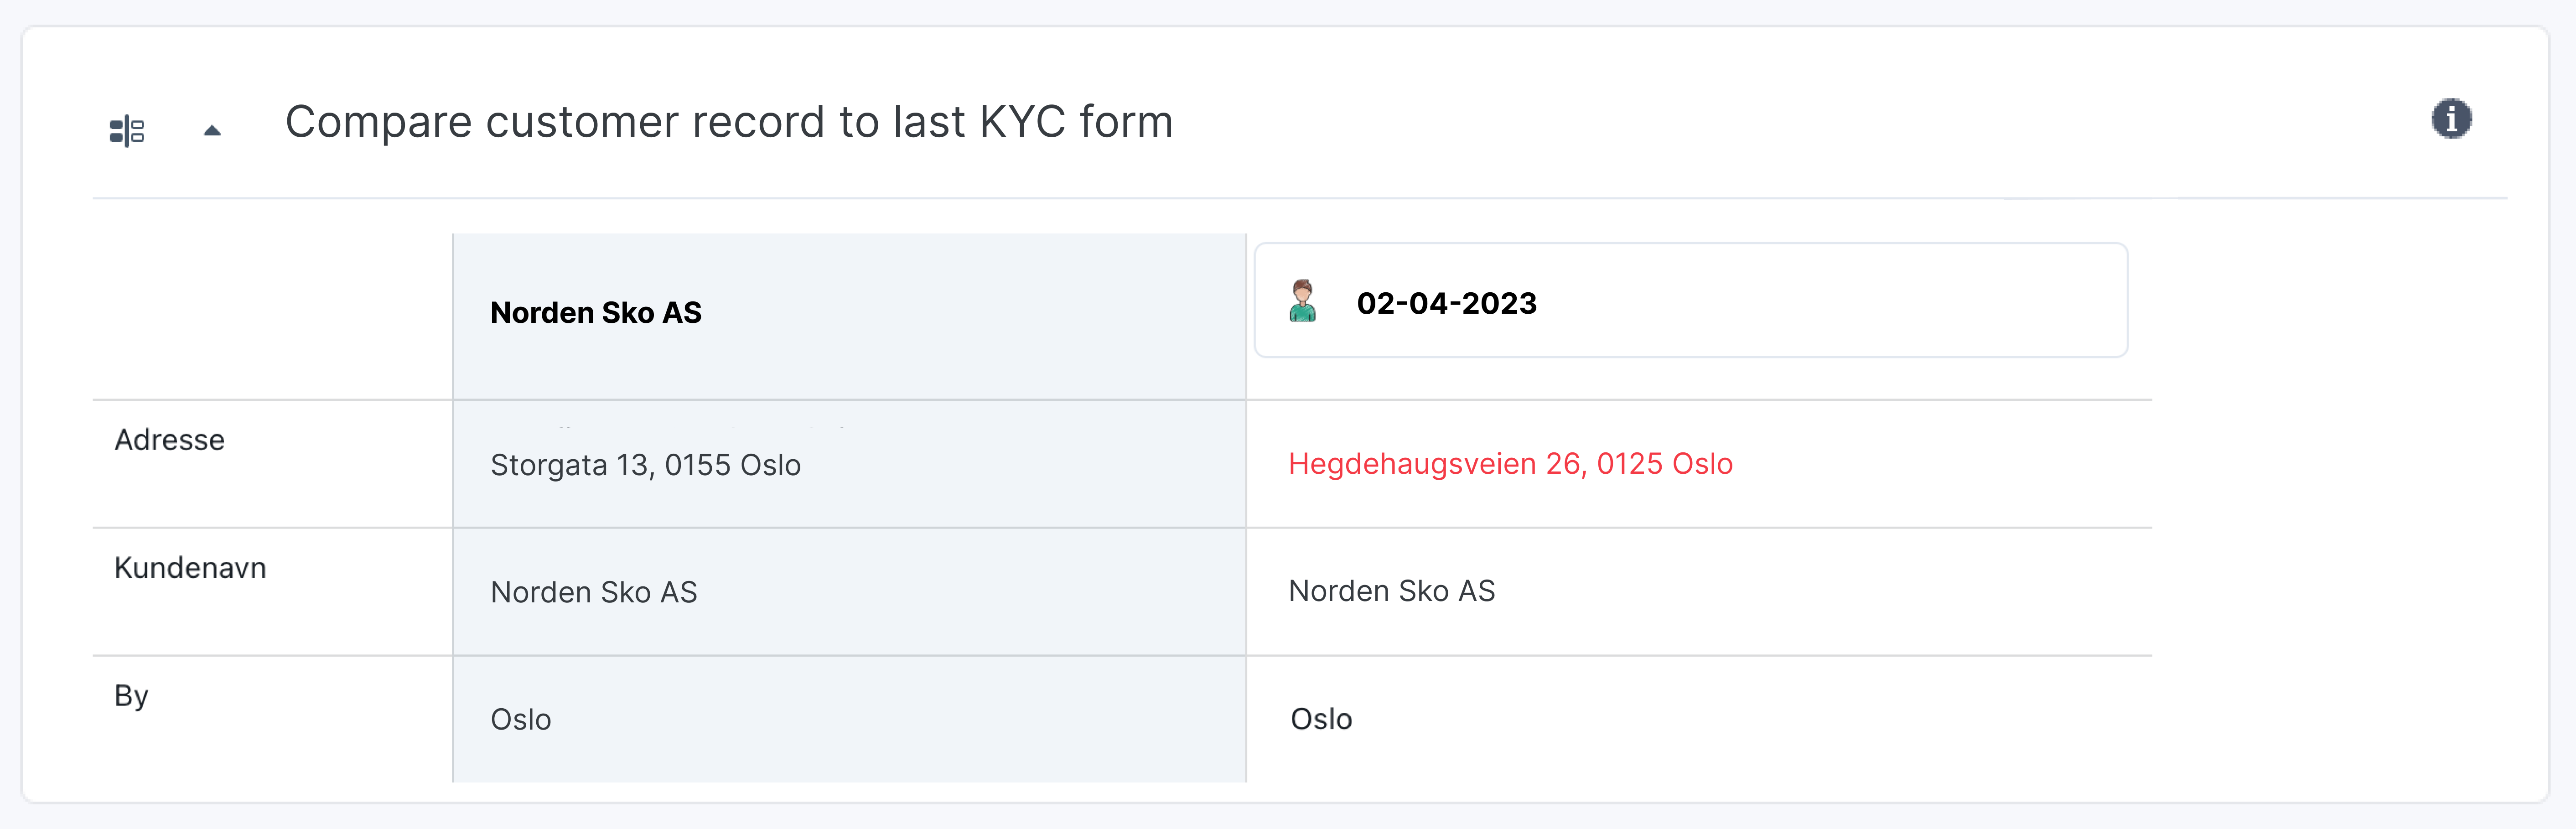
An object comparison chart is useful for comparing property values from different objects. Property fields with differing values will be highlighted in red.
Flow chart
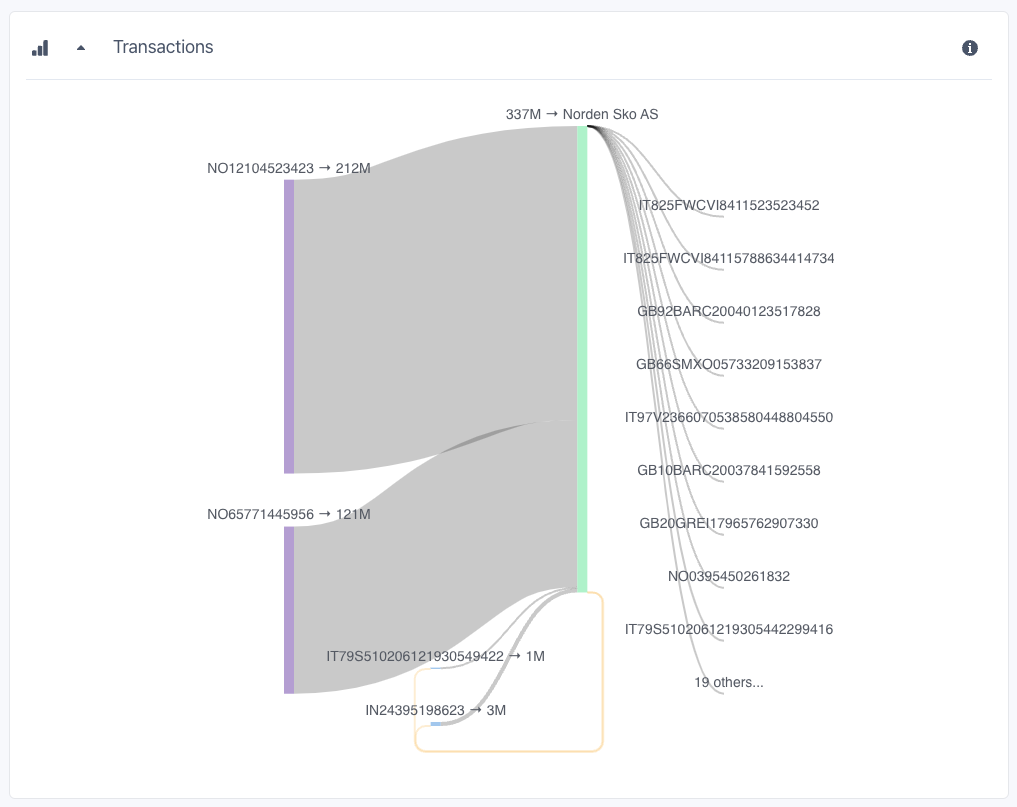
The flow chart shows how something flows from one place to another. An example is how money flows from one account to another, or from one country to another. A line in the diagram represents an object (e.g. an account), and the band between two lines represents flow of something (e.g. money). A broader band equals a larger flow.