The Convier data model
Connecting your data sources to the Convier platform will give you the ability to view, navigate and investigate your data, and the relationship between them, in a completely new way. The secret to this is how data and relationships are represented in the platform. The following section describes the different concepts that make up the Convier data model, and how they play together.
Objects
Data objects are at the center of the Convier data model. An object is the representation of some entity in a data set. An example of an object could be a person, a company, a transaction or a customer activity event.
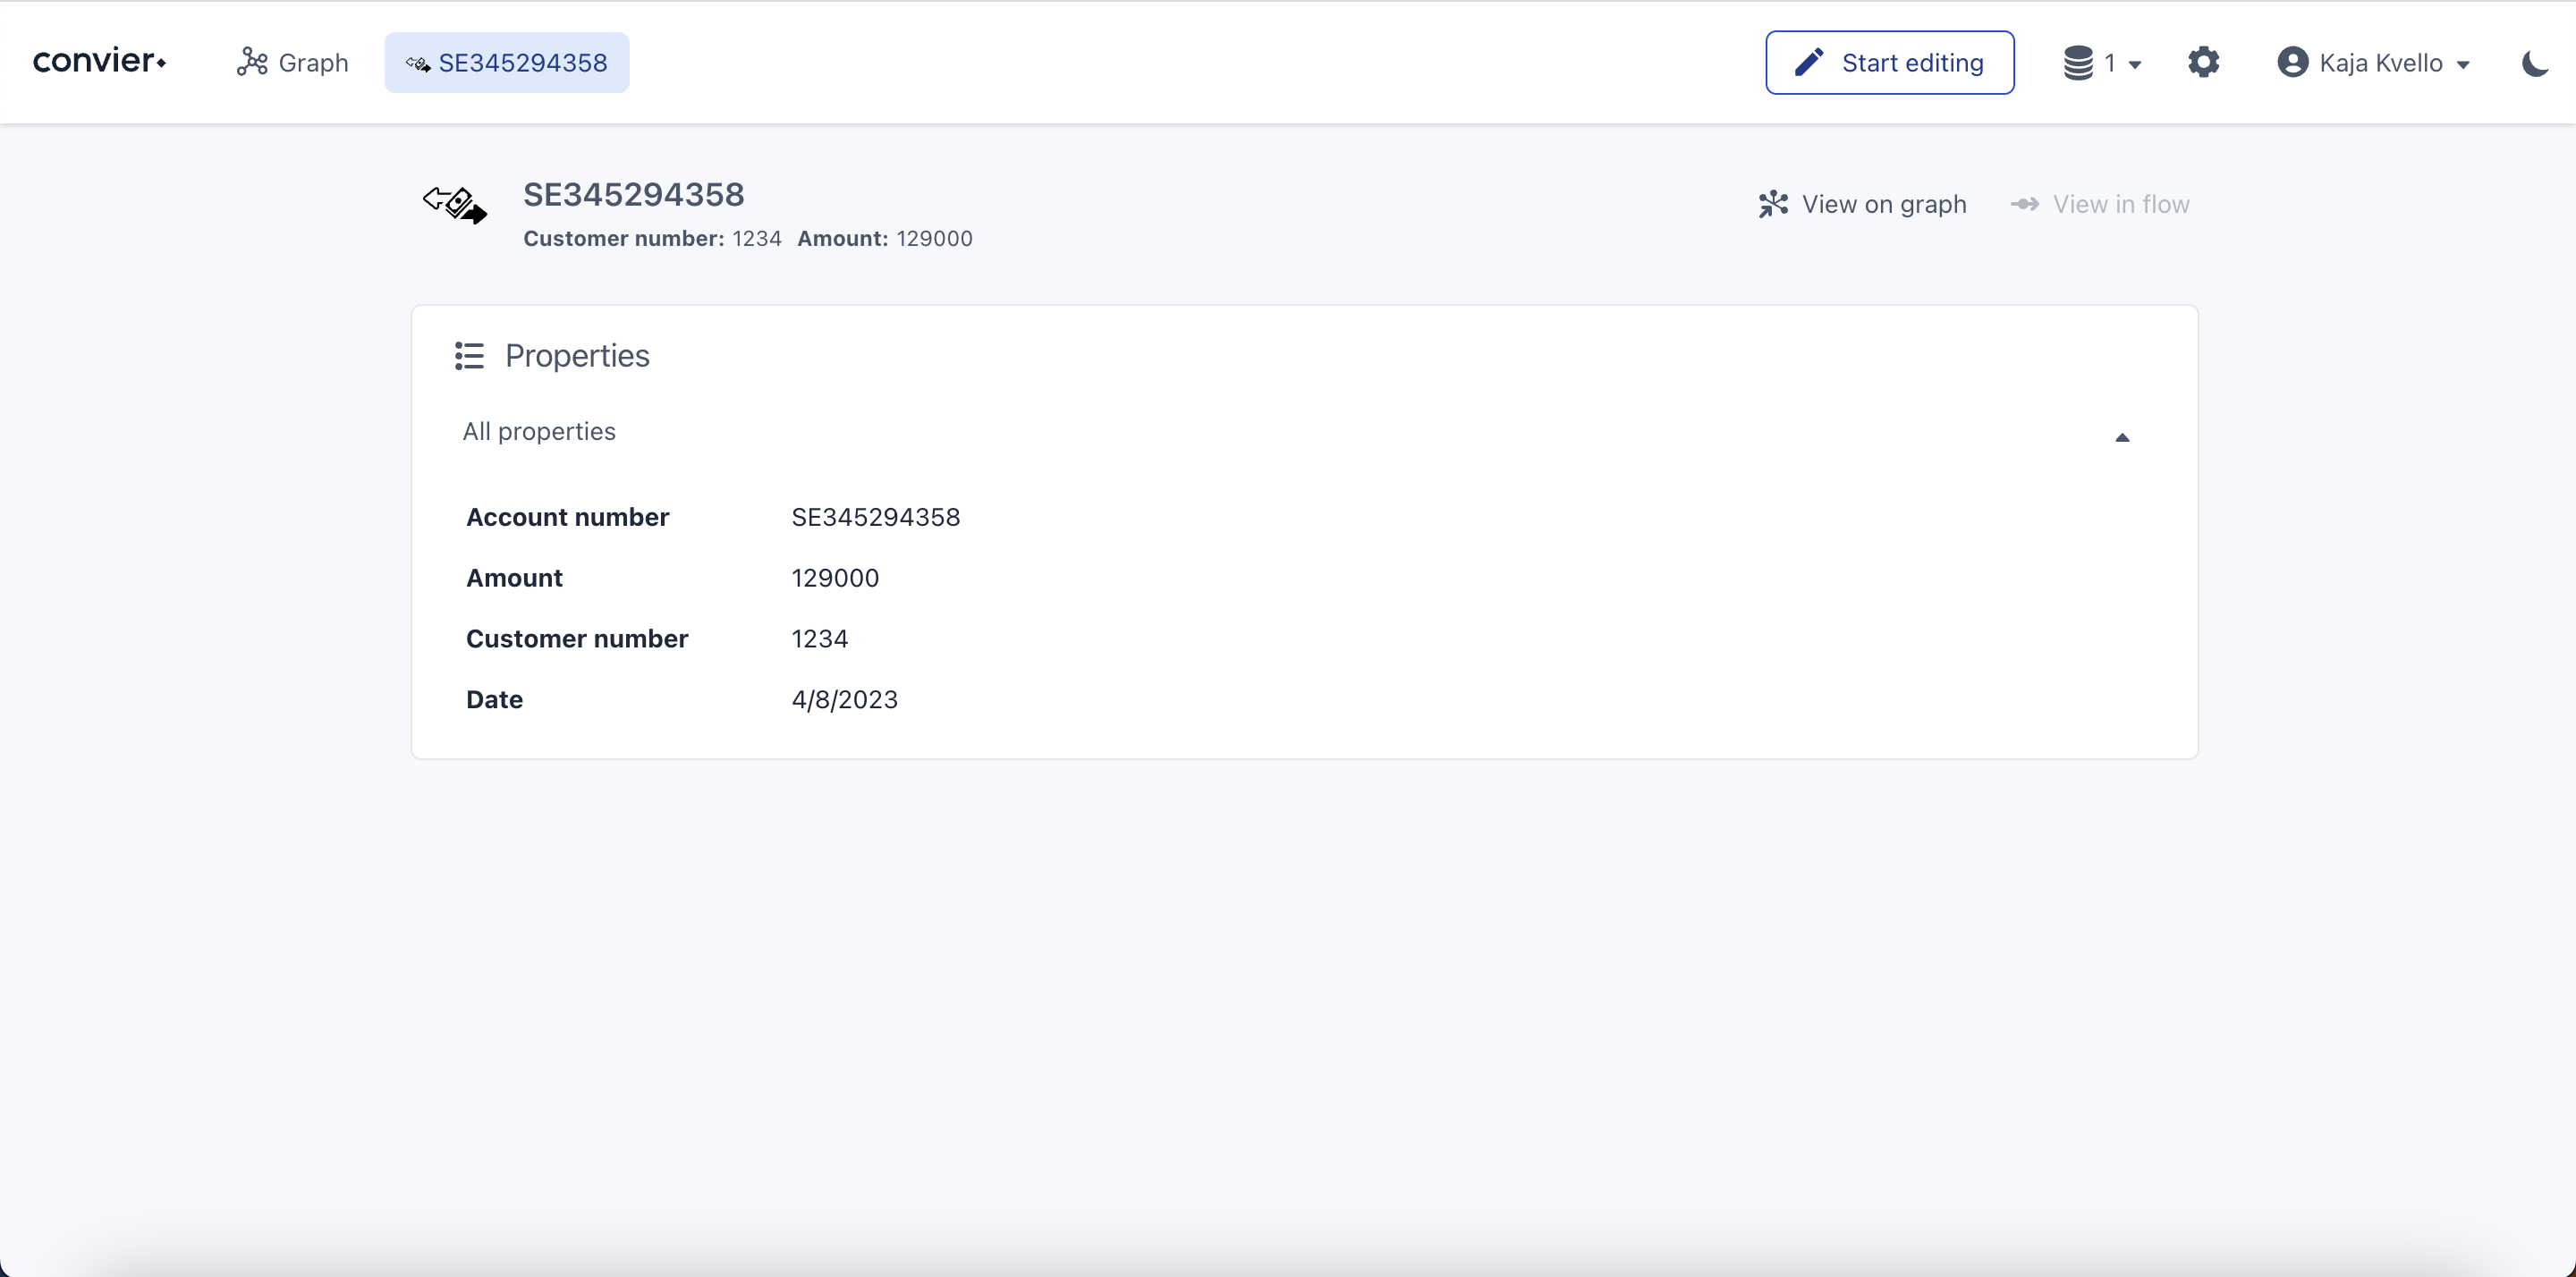 An object view showing an Outgoing transaction object
Objects consist of a collection of properties. Examples of properties can be the customer ID number, a transaction amount or the date when an activity took place.
An object type is a template describing the properties of one type of data entity. One object type will contain data from a single data source (e.g. a database table, a graph database, a spreadsheet).
Object types can also be associated with links to other object types, control checks and chart configurations.
Links
A link describes some sort of relationship between two objects. The link can exist between objects of the same type, or between different object types. Links can also exist between data objects from different origin sources.
Examples of a link between objects:
- Two objects that represent information about the same customer across different data sources (f.ex. a Customer object from the CRM database and a Customer Account object from the account register database). These two objects contain information related to the same physical customer, and can therefore be represented as two linked objects.
- Two separate customer entities that share the same address. These objects represent two different physical customer entities, but since they have related information they can be represented as linked objects.
- The fact that a person is a shareholder in a company can be represented as a link between the Person and the Company objects.
Charts
A chart is a way of visually displaying relationships between data. The chart will retrieve the results of some pre-configured search, and display them in a visually helpful manner. The pre-configured search can be a combination of finding linked objects, filtering and doing set-operations on a combination of search results. An example of such a search could be to start with a Customer object, find all linked Transaction objects and then filter out results with a Transaction Amount below 500 USD. The results could then be displayed as one of the following chart types:
Object list
Show all matching objects in a list.
Controls
A control is a way to indicate a detected risk on a specific object. The control status is a result of computing different data related to the object in question. An example of a control could be to detect whether a customer has a link to any money transactions to a foreign country. The result of the computed control will be displayed on the object view it has been configured for.