Version 0.2412.5
Updates for admins
Conditional color formatting in tables
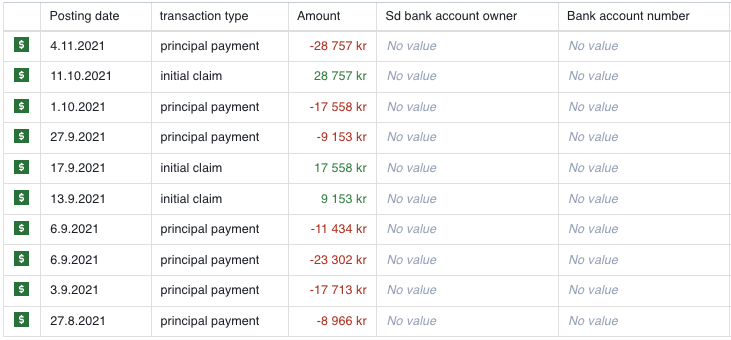
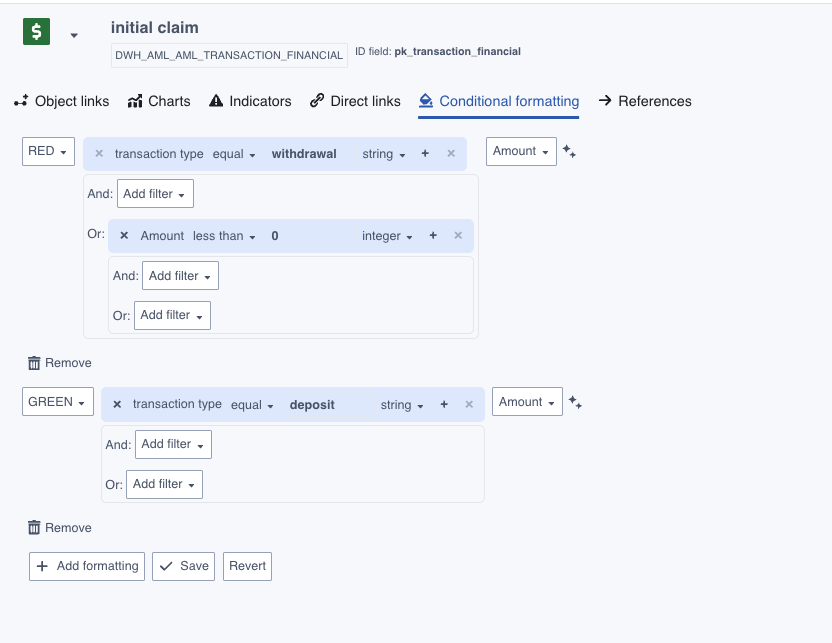
It is now possible to make fields appear with a specific color, depending on some condition. A typical example is making transaction amounts appear as red/green depending on whether the transaction is a deposit or a withdrawal. To configure conditional formatting for an object type, follow these steps:
- Go to the object containing the field you want to set the color for (e.g. the Transaction object)
- In configuration mode, go to “Edit object” -> Conditional formatting
- Set the configuration for the conditional formatting. In the picture below, the settings are described from left to right:
a. Choose the color to set on the field
b. Set the conditions that should apply for this volor to appear. In this example, transactions with negative amount or type “withdrawal” will be colored red, transactions with type “deposit” will be colored green, all other transactions will be colored black as normal.
c. Choose which field should appear with the selected color (Amount, in this case) - Click “Save” at the bottom
Version 0.2409.10
Improvements to the browse application.
Browse configurations
Before this release, changes to browse configuration were remembered within the browser. From this release, configuration to browse needs to be saved to application config to be persisted. Links to saved browse configurations have been moved to the home page and relvant object views.
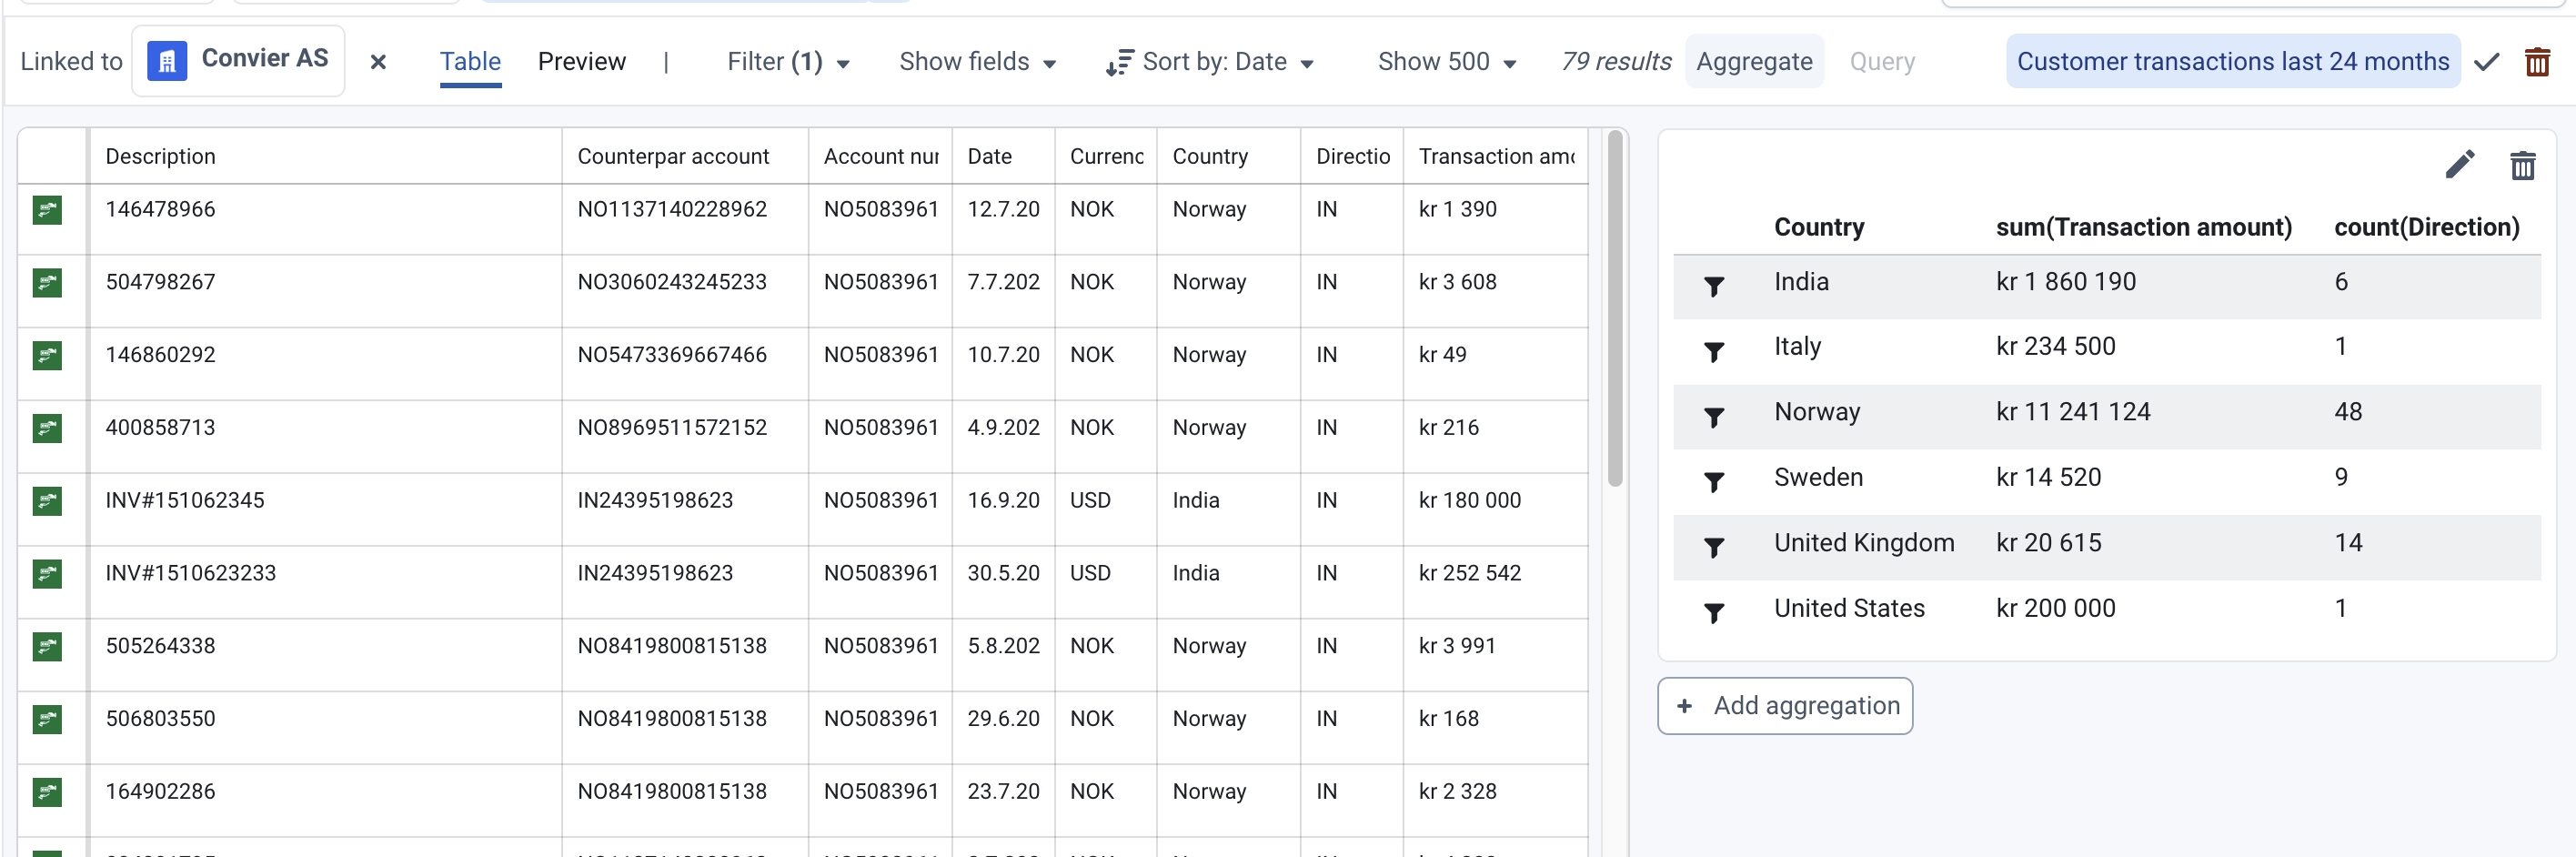
Browse aggregations
We have added the possibilty to create aggregations on rows shown in the browse application. Aggregations can be added by clicking “configure” in the bottom left corner, and then click “Aggregate” in the top bar of the browse app.
Browse pivot
We have added the possibility to pivot on objects in the browse app. The primary use case is to browse transactions linked to a given customer. Pivots can be configured by clicking “configure” in the bottom left corner, and then click “Query” in the top bar of the browse app.
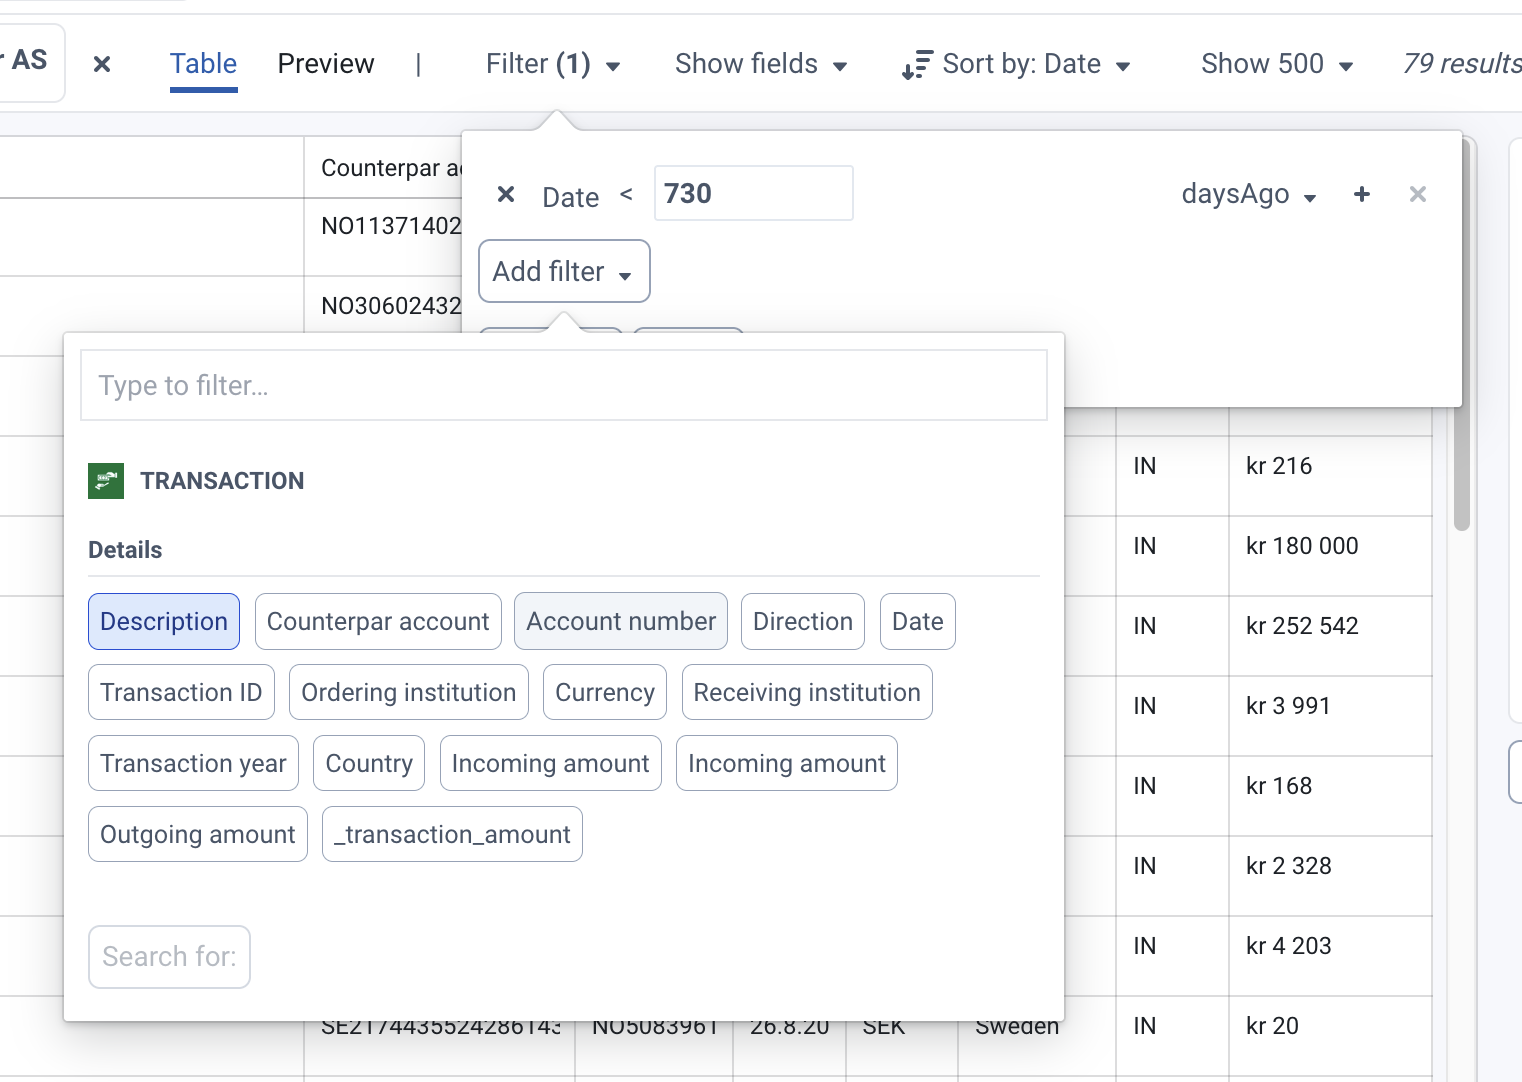
Browse filters
We have improved the filter dialog within the browse application to include multiple values, more filter types and filter data types.
Version 0.2409.1
Features
Reporting V2
We have created new reporting functionality which is enabled by adding the feature flag “REPORTING_V2” to the project feature flags. This functionality will at some point completely replace the previous version of reporting, called “Report Templates”.
Actions on SQL sources
We have added functionality to update SQL data sources directly from the Convier frontend through Actions. The functionality is limited to updating fields in rows and can be enabled from the data source configuration.
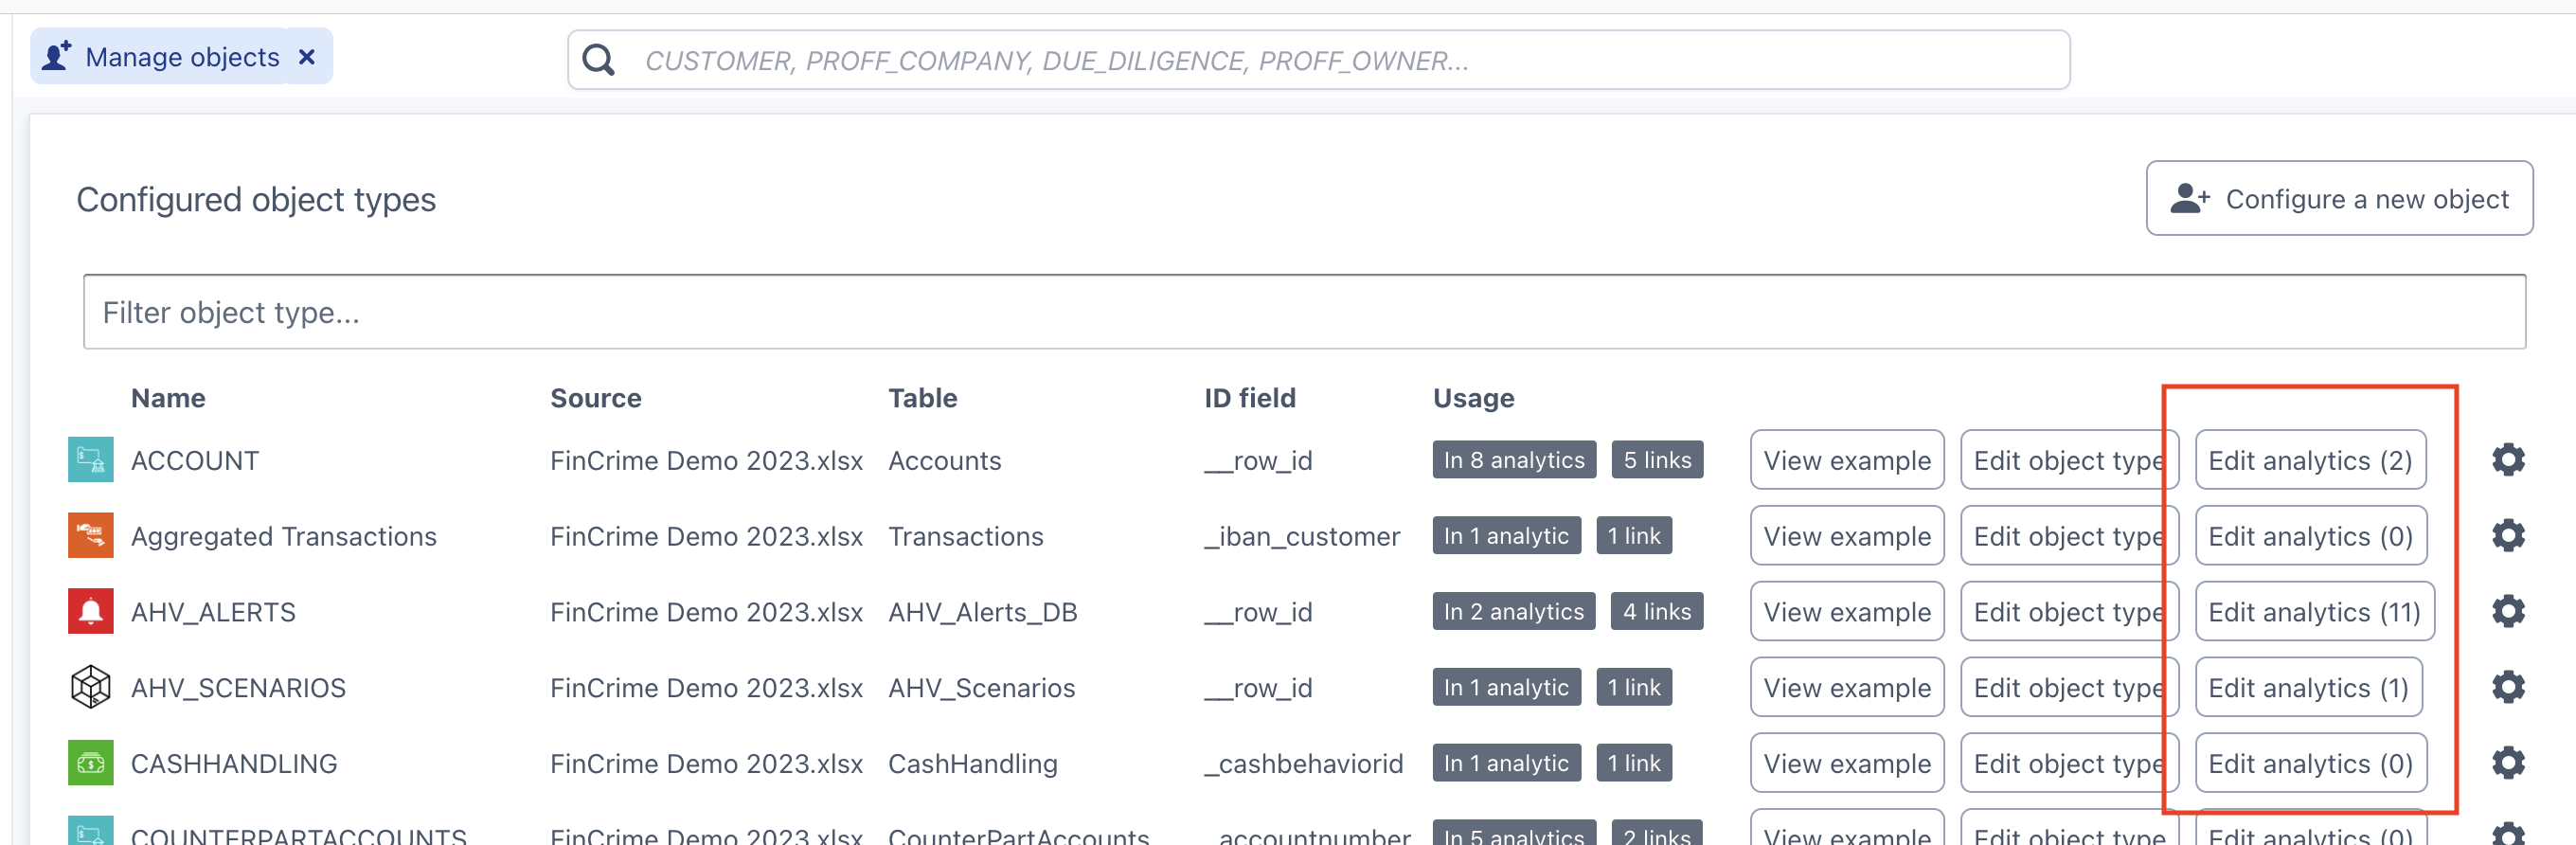
Object type analytics
We have added the option to edit raw analytics from the “Manage objects” page. This removes the need to go to “Advanced configuration”
Version 0.2407.4
Updates for users
New behaviour for tabs and navigation
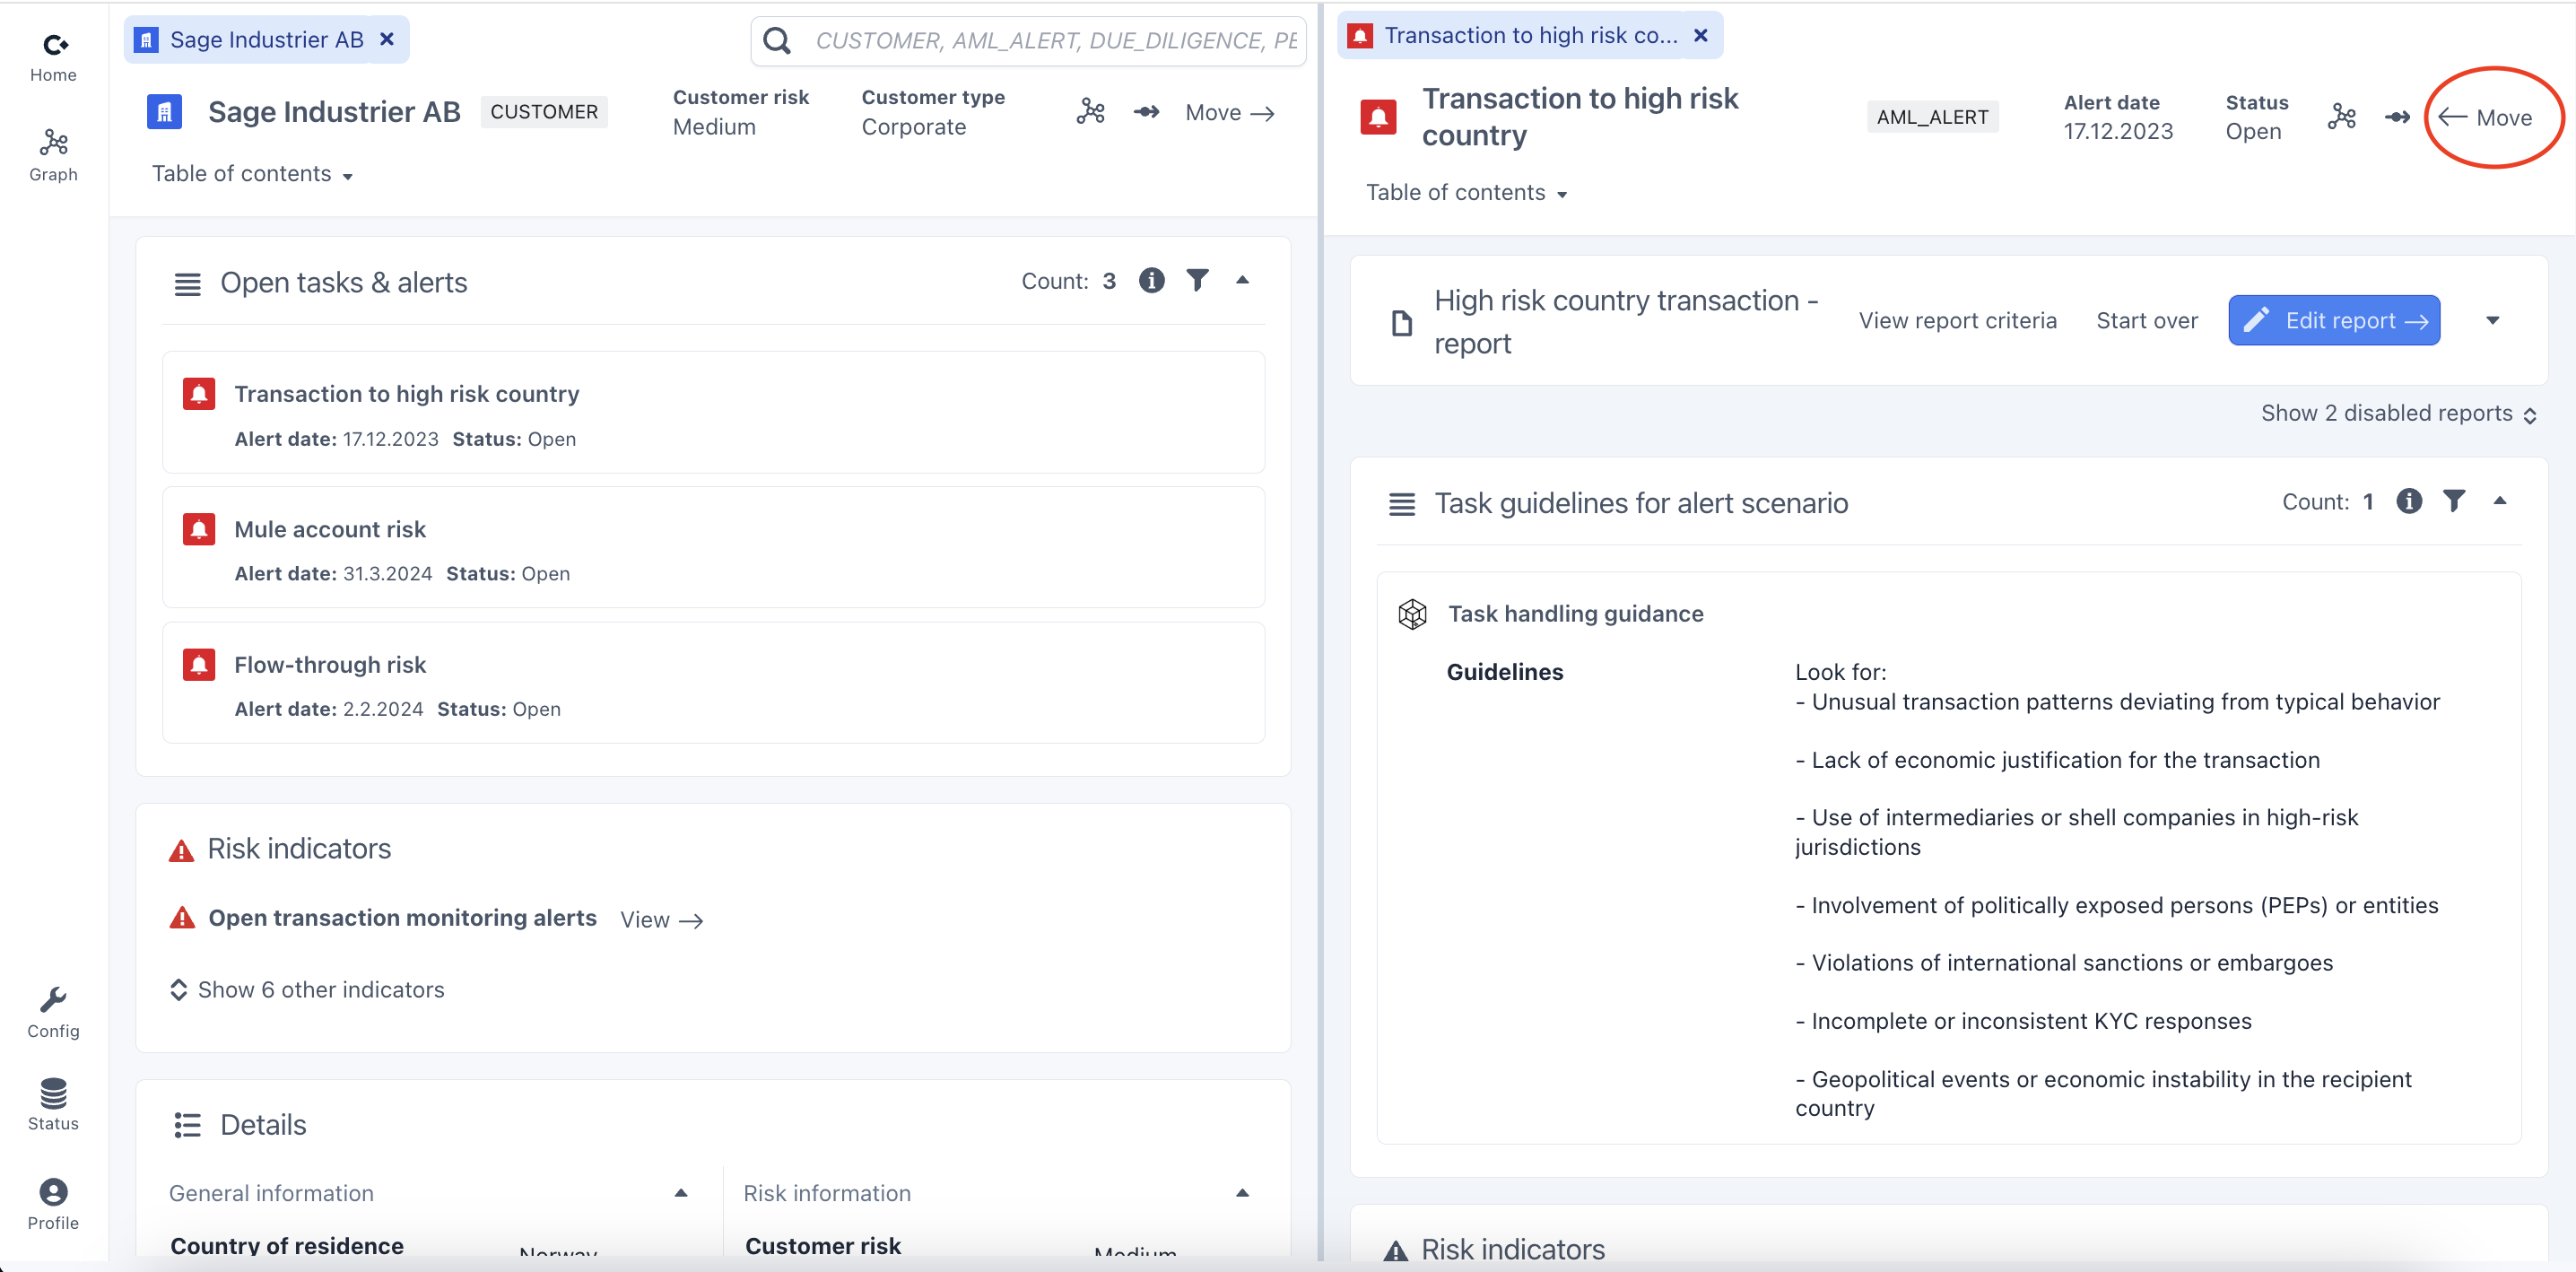
The way to navigate between views has changed slightly in this update. When opening a new object view from “Browse” or Search results, “View full object” will open a new tab with the selected object view. From here, any subpage or new object view opened will appear in the breadcrumb trail underneath the tabs in the topbar. Any view can be put into a dedicated tab by clicking the “Make tab”-button on the top-right side of the view. Close any tab or breadcrumb by pressing the “x”. 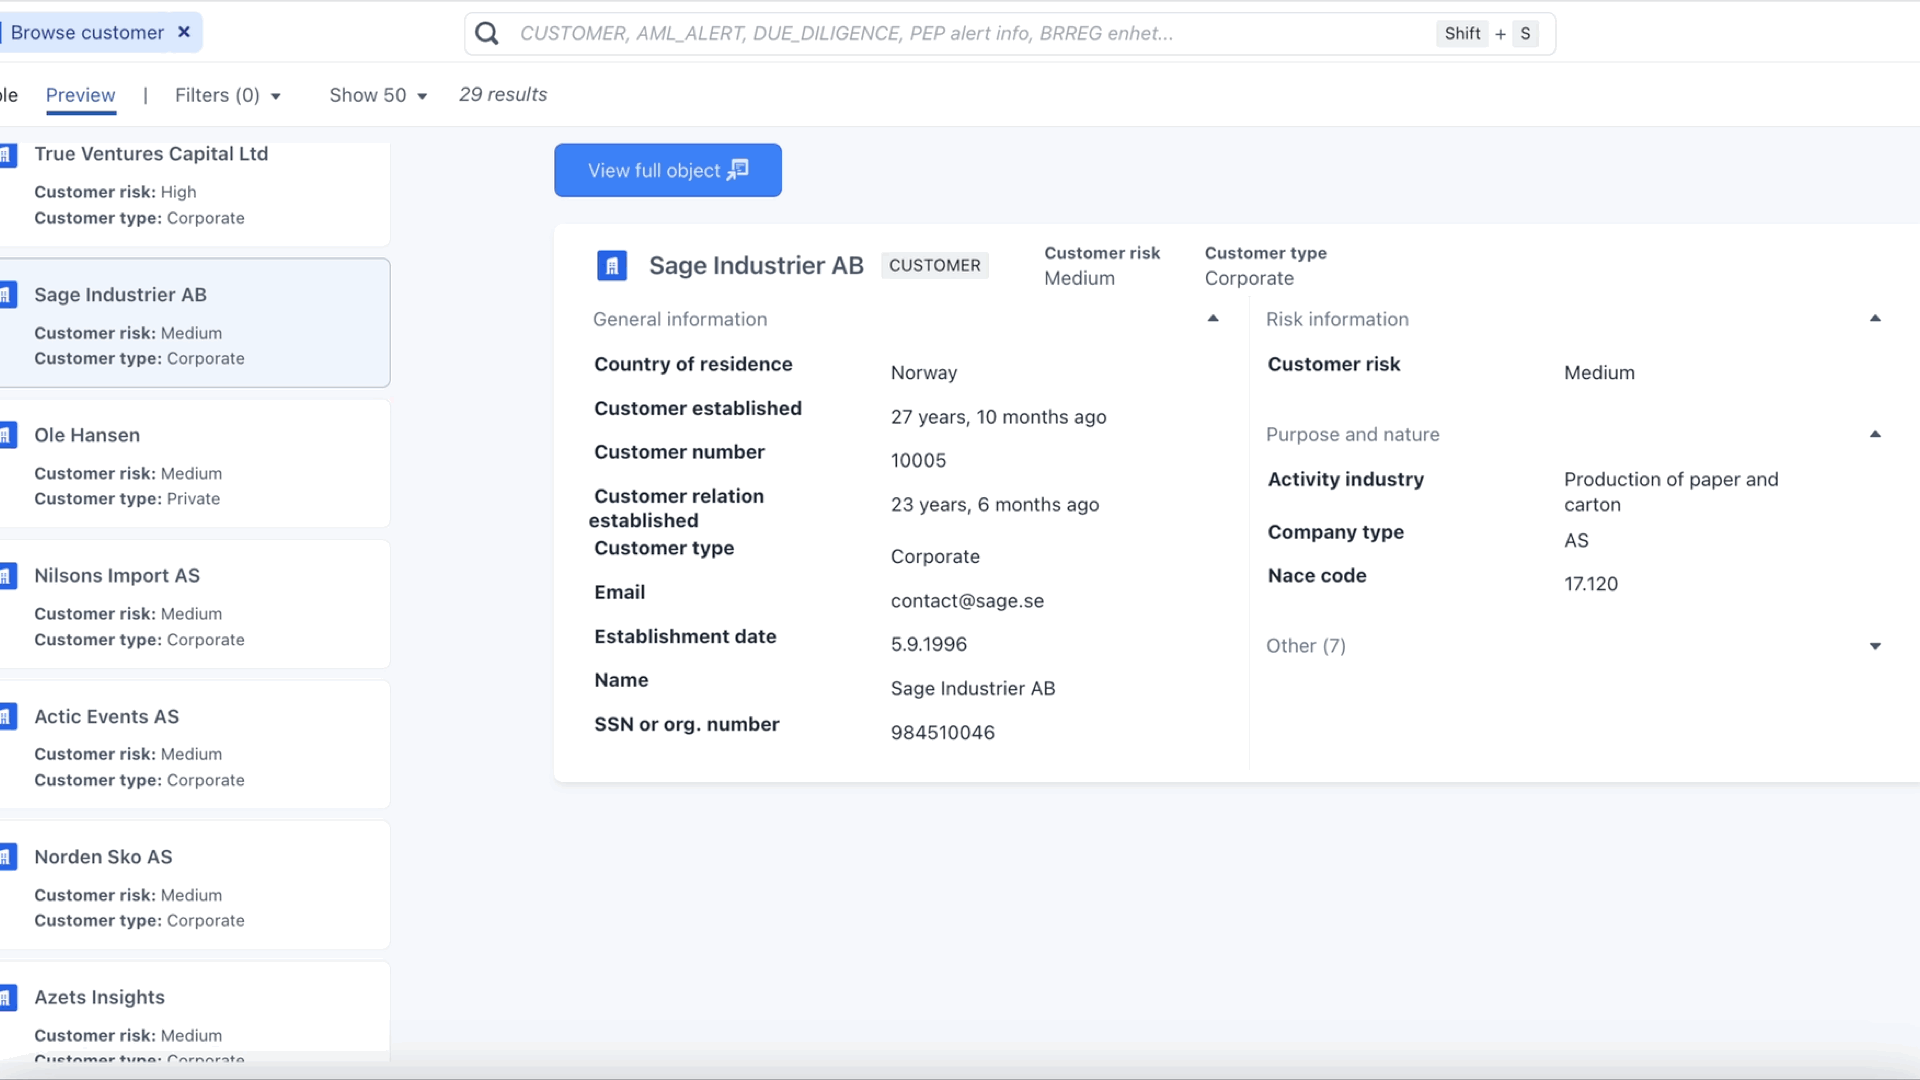
The screen can also be split in order to create a side-by-side view. Simply click the “Move ->”-button on a view to move it into the side-view, or the “<- Move”-button to move it back to the main view. 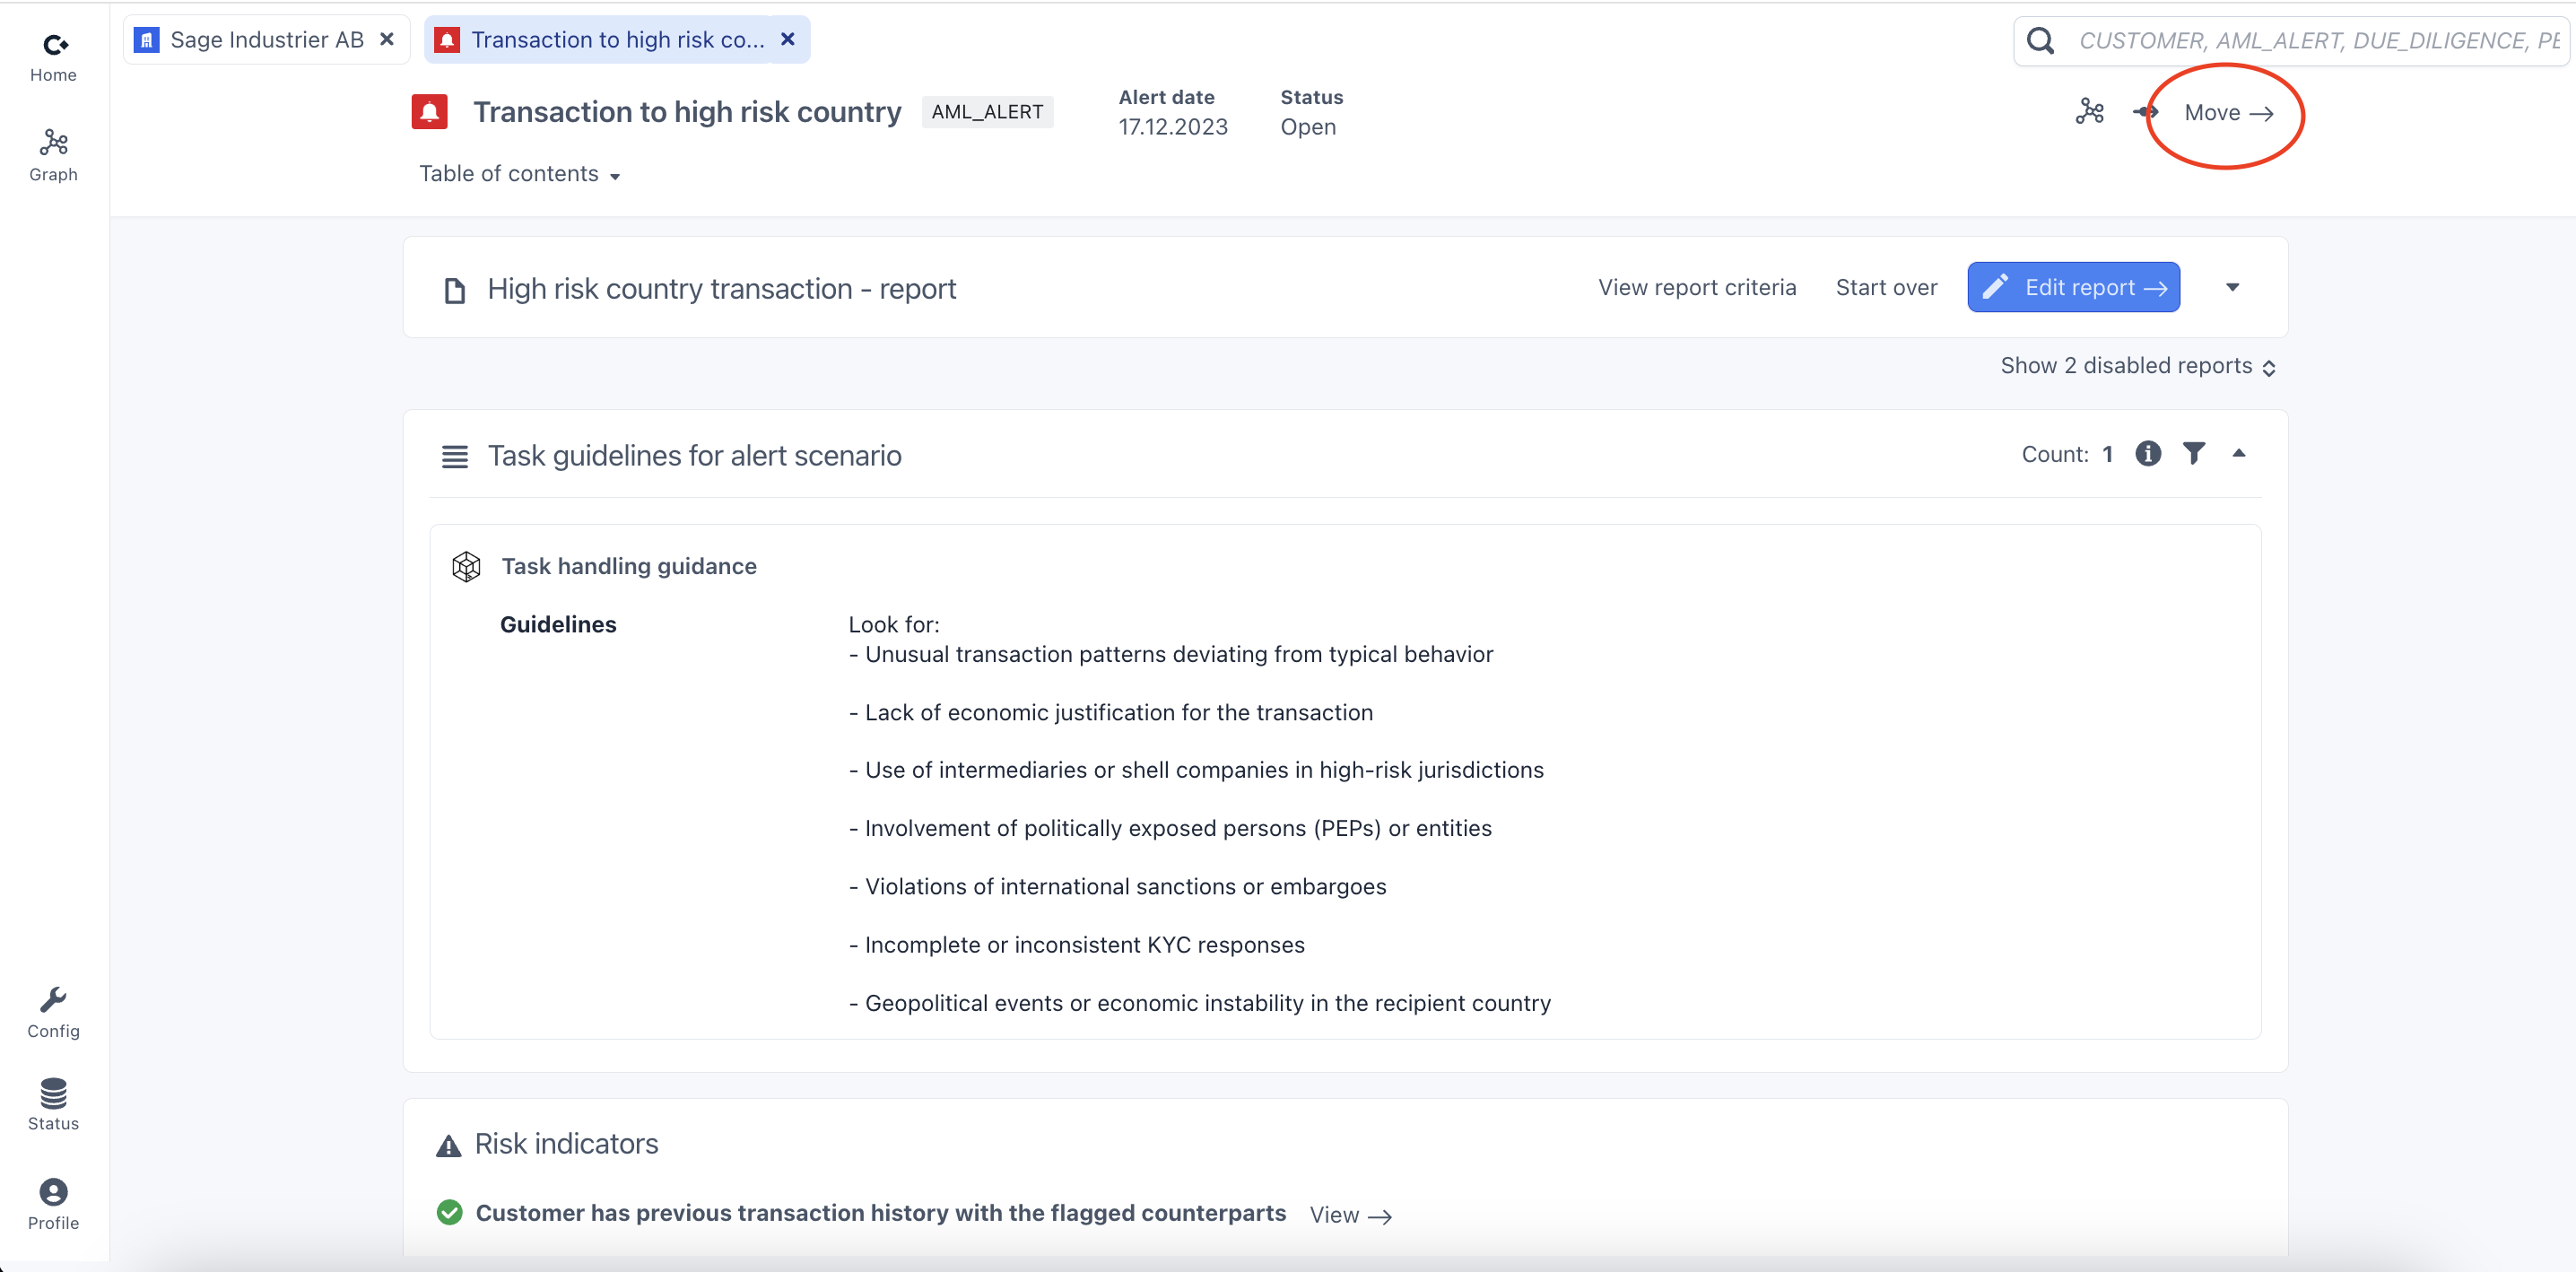
Updates for admins
New home for config button
The config button has been moved to the left menu sidebar. The save/discard changes functionality otherwise works the same as before. 
Improved UI for creating charts
Setting up an analytic to retrieve the correct set of objects to display in a chart just became easier. Each step in the analytic now has a “load” button, showing a preview of the objects that will be retrieved in that step. The “Histogram” button will show a barchart with an overview over all observed values for the selected property. Clicking one of the values will automatically add a filter to this step. The example below shows a step retrieving all transactions linked to a customer. Clicking “Load” shows that the step finds 96 linked transactions. When setting up a histogram for the “Country” property, we see that this set of transactions contain transactiuons with India, Italy, Sweden and Norway. Clicking the “Sweden”-bar will add a “Country”-filter to this step, which can be extended to include all transactions to “Sweden”, “Norway” or “Denmark”. 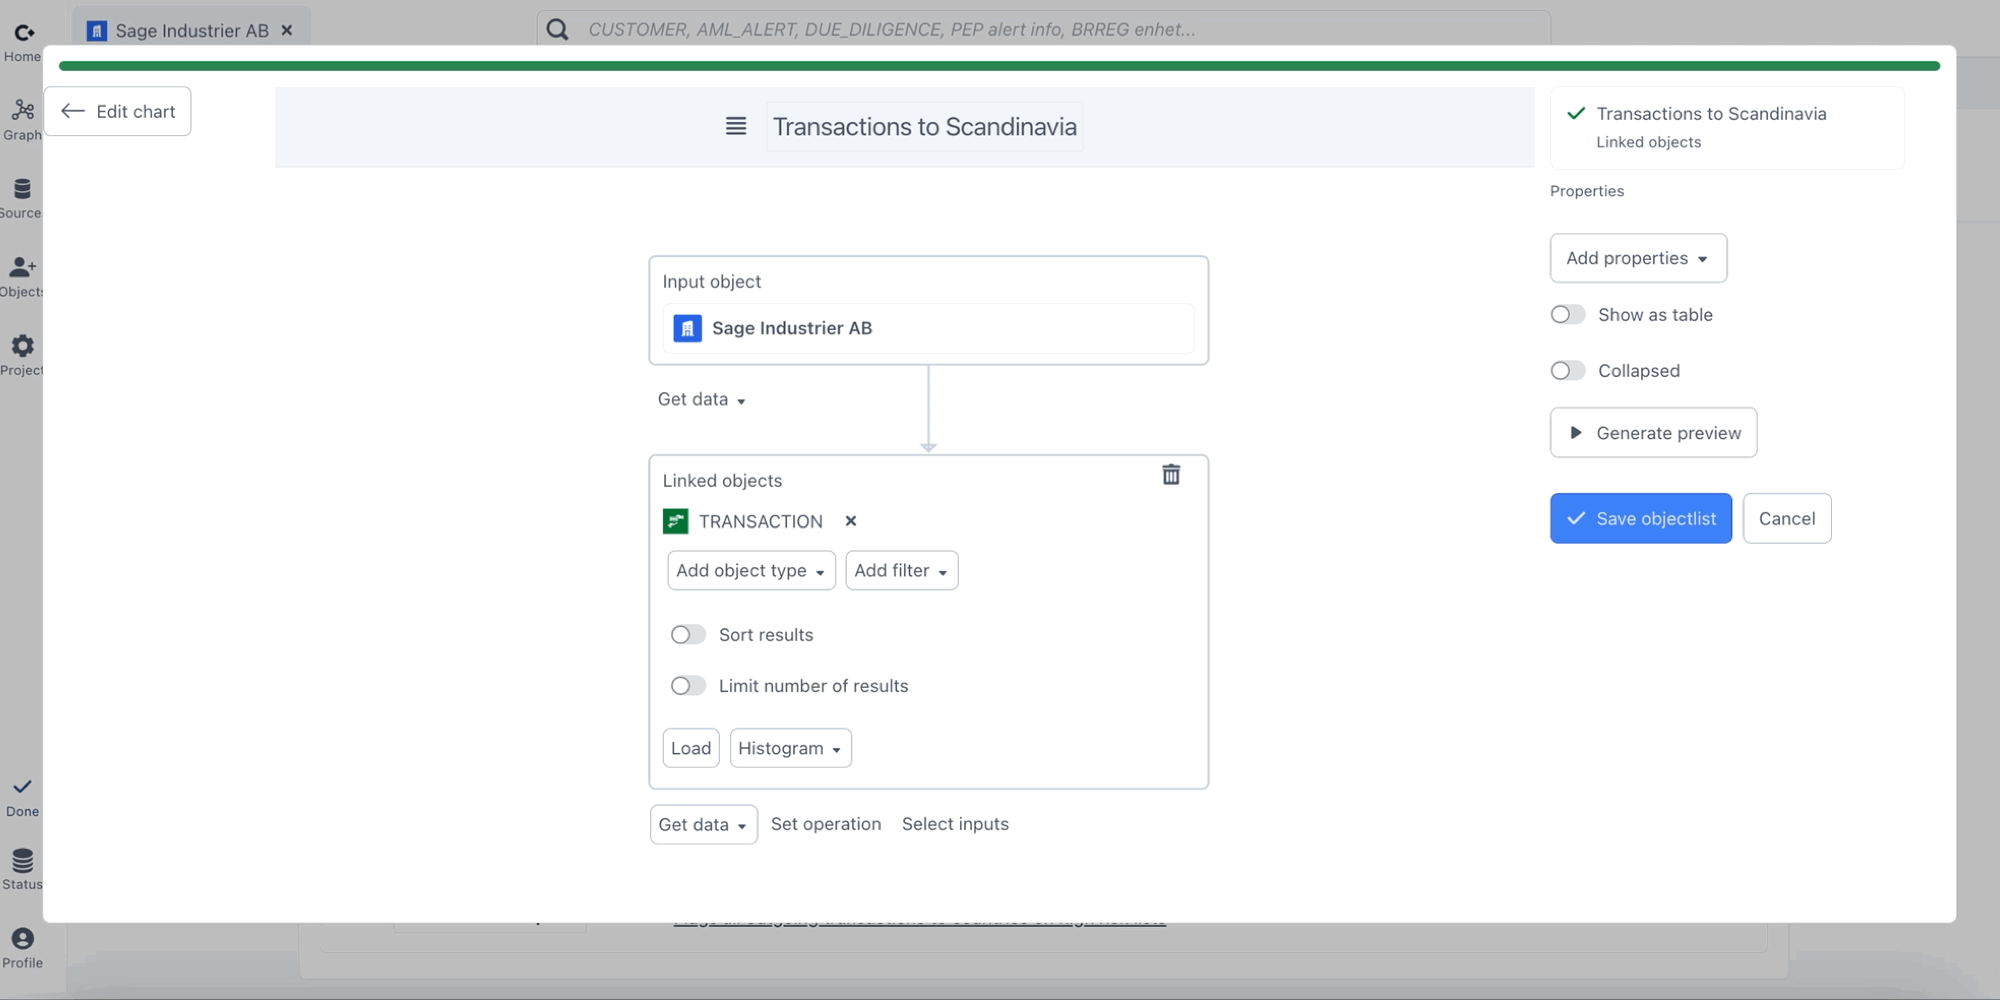
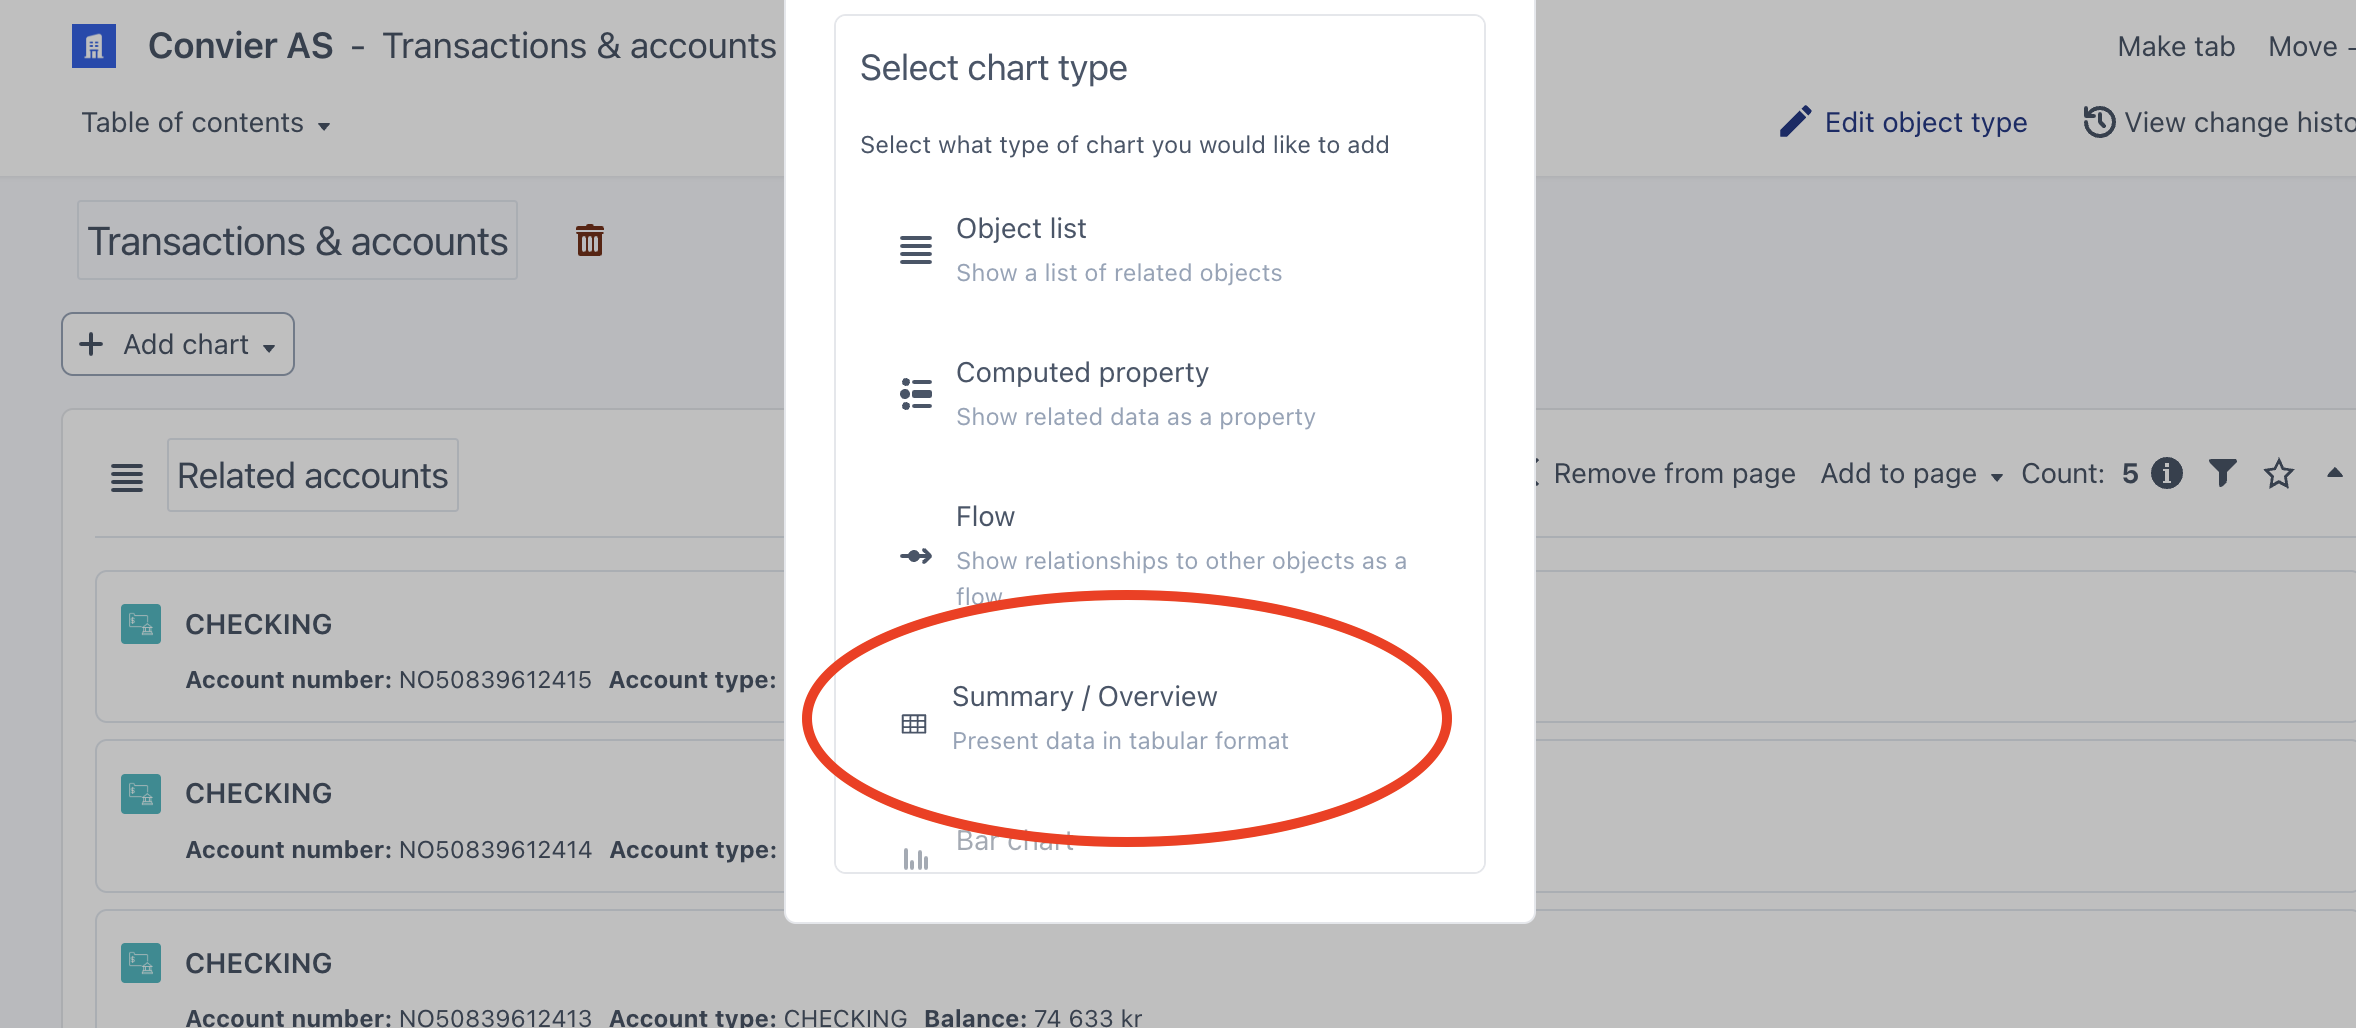
New summary chart
A new chart type has been added, allowing admins to display selected properties side by side in a table view. Create a Summary chart by selecting “Summary / Overview” in the “Create new chart” menu. From here, you can add as many rows and columns as needed, and select which property/field to display in each cell. 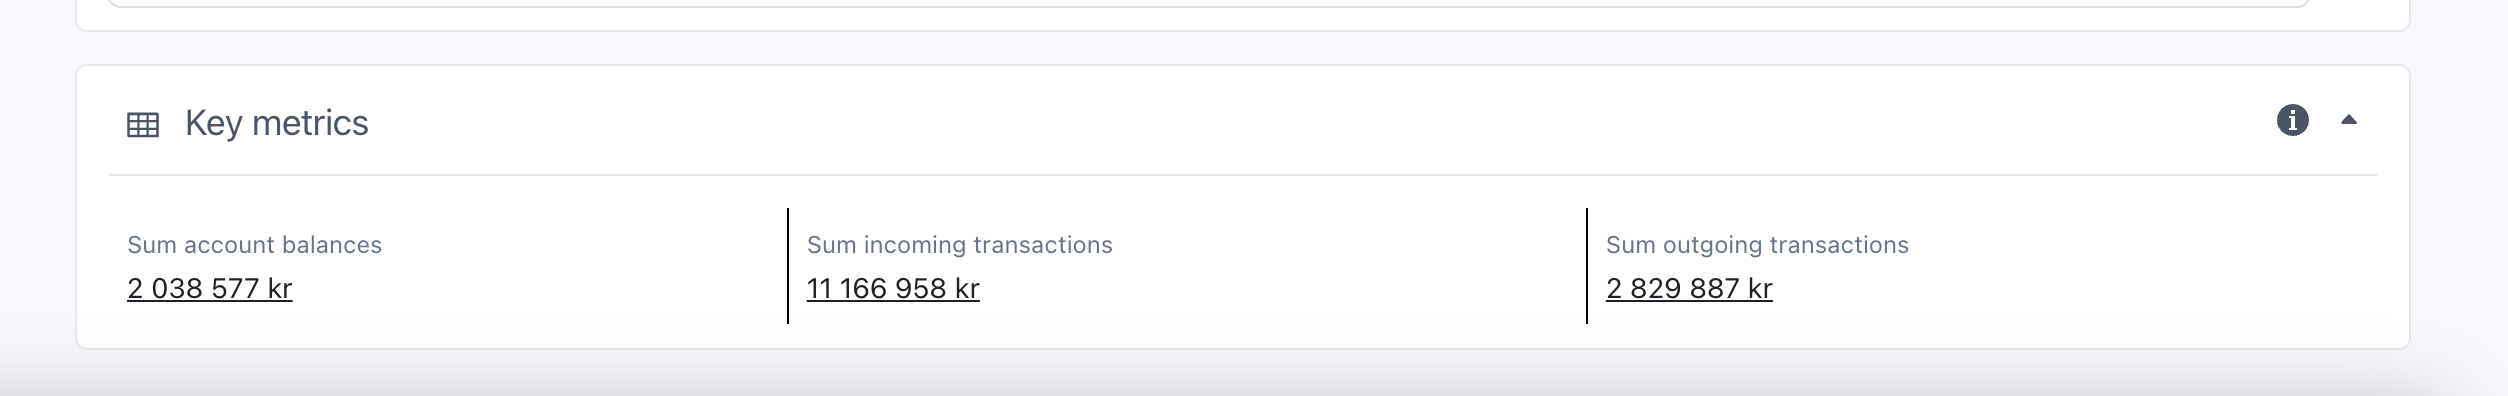
Version 0.2406.13
Updates for users
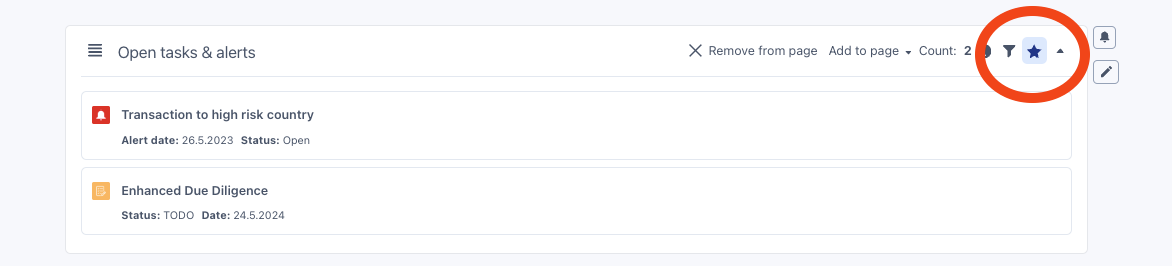
Promoted charts on object front page
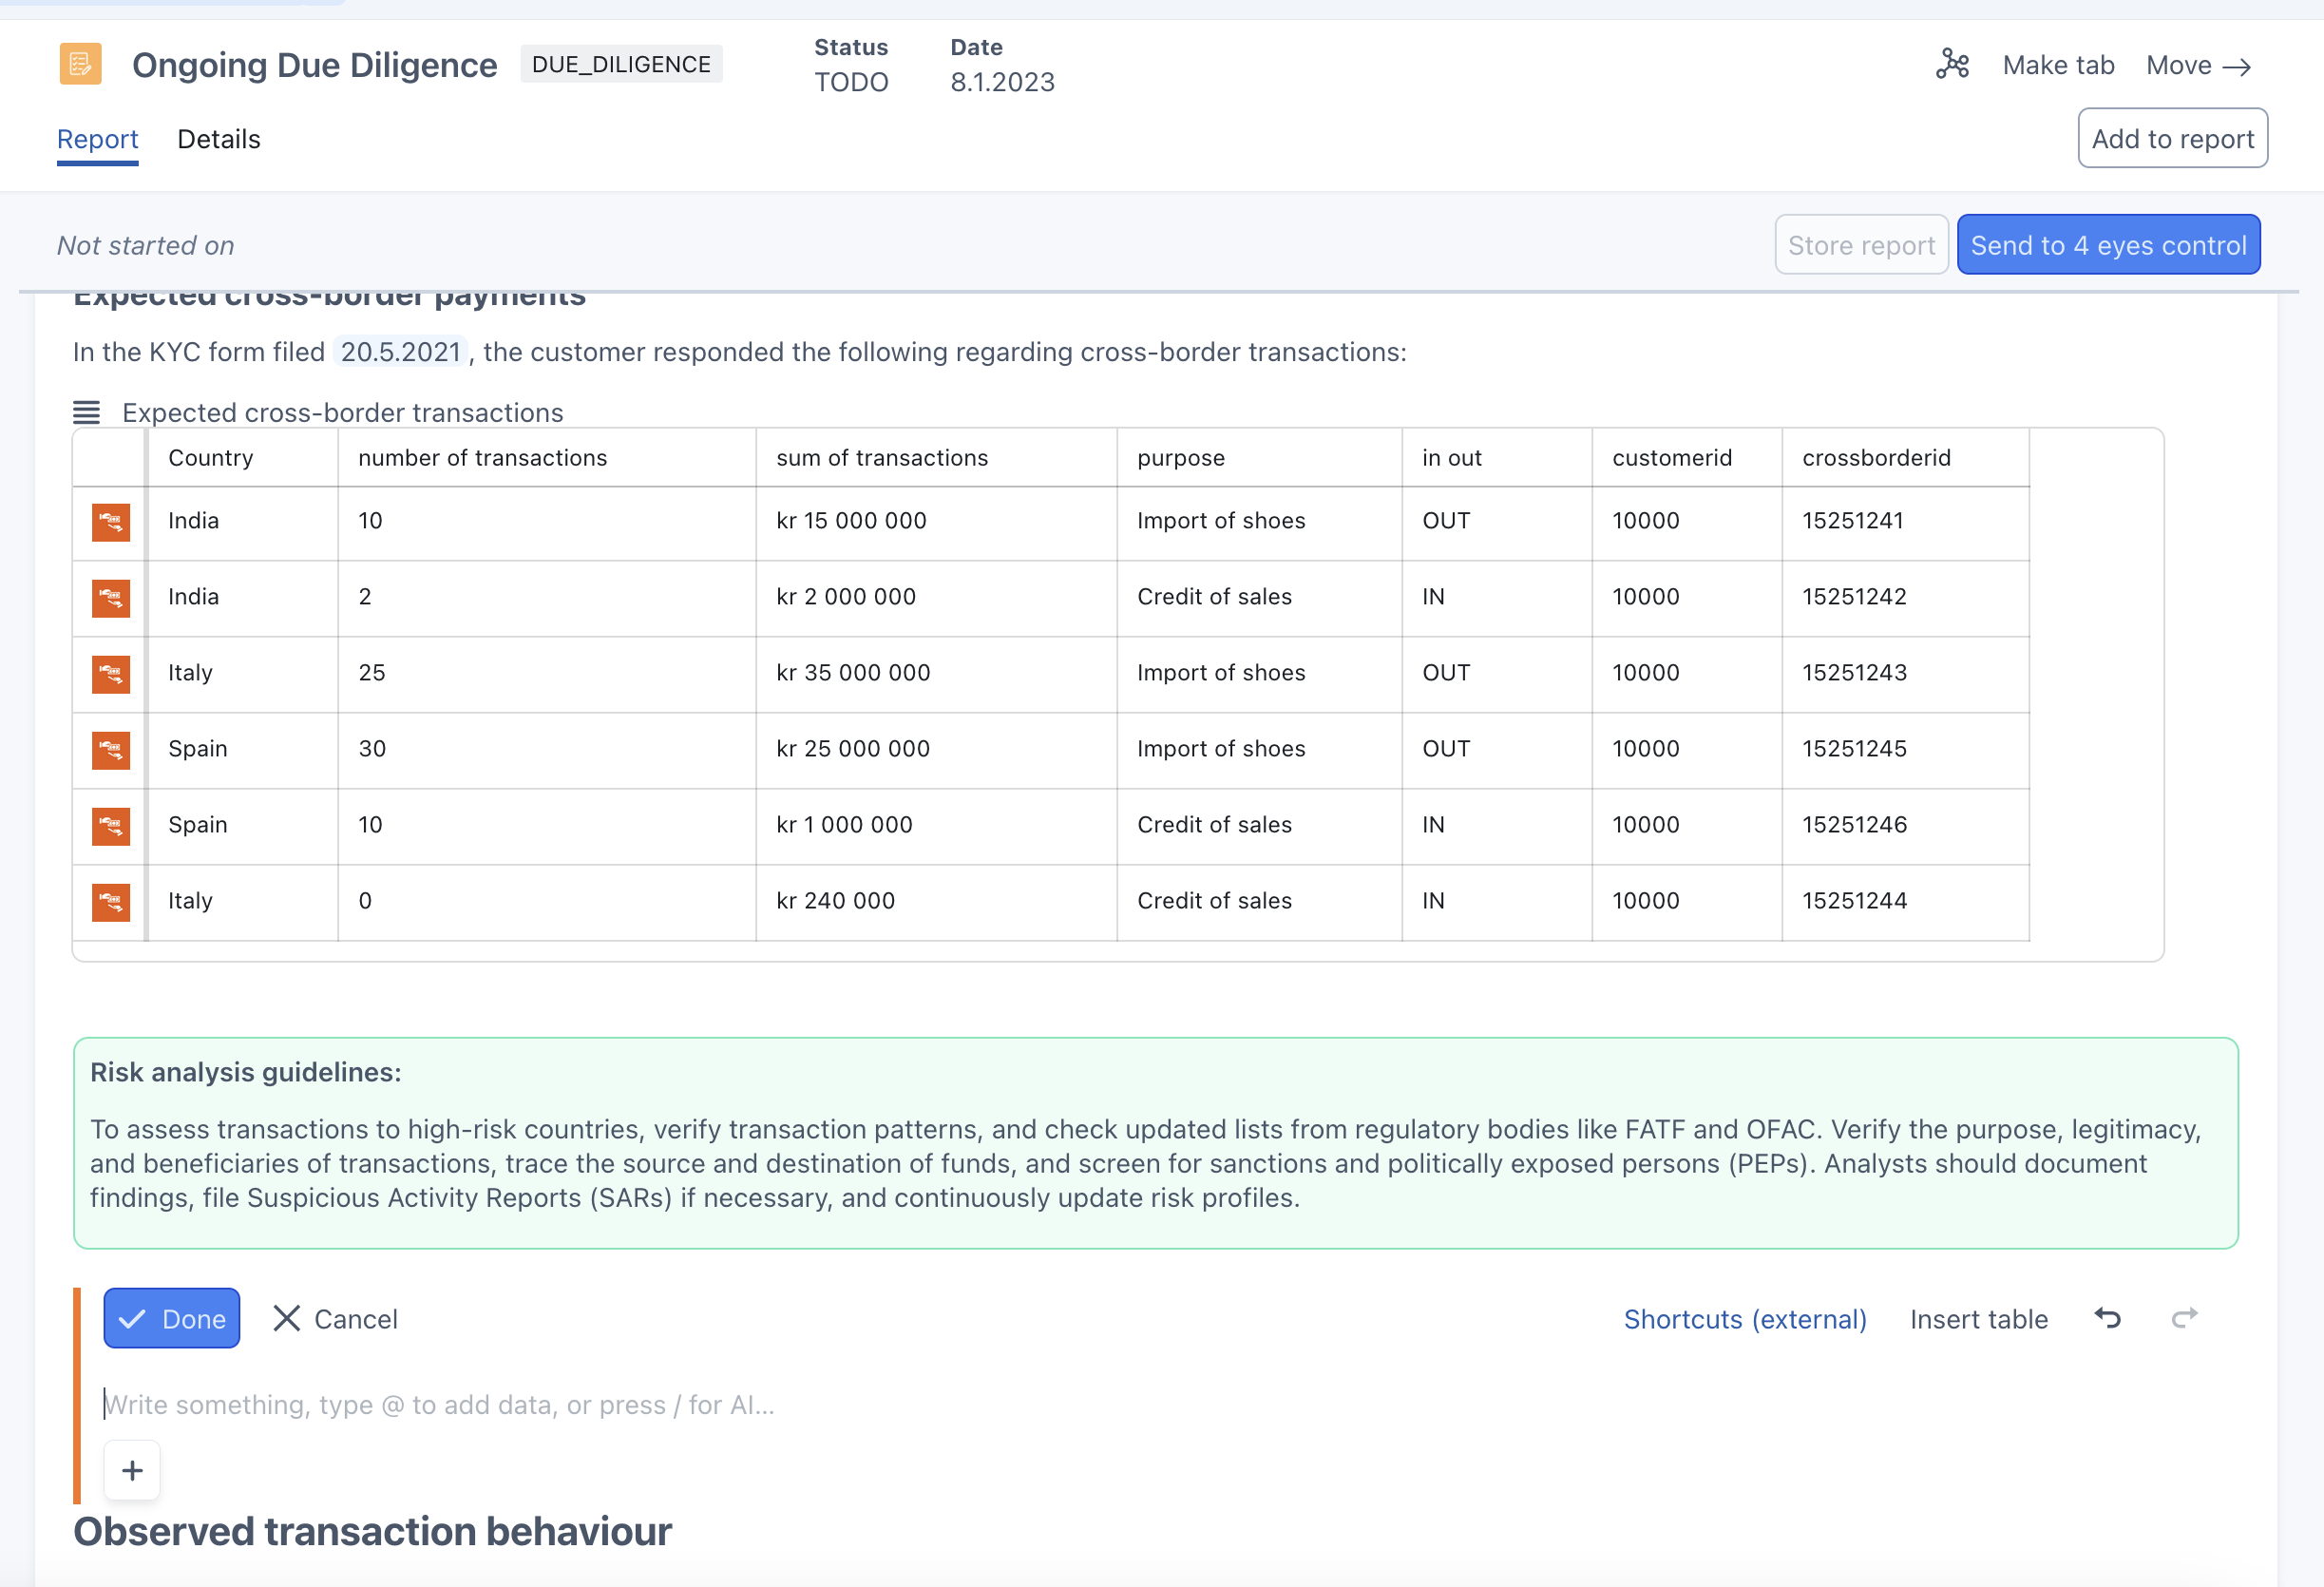
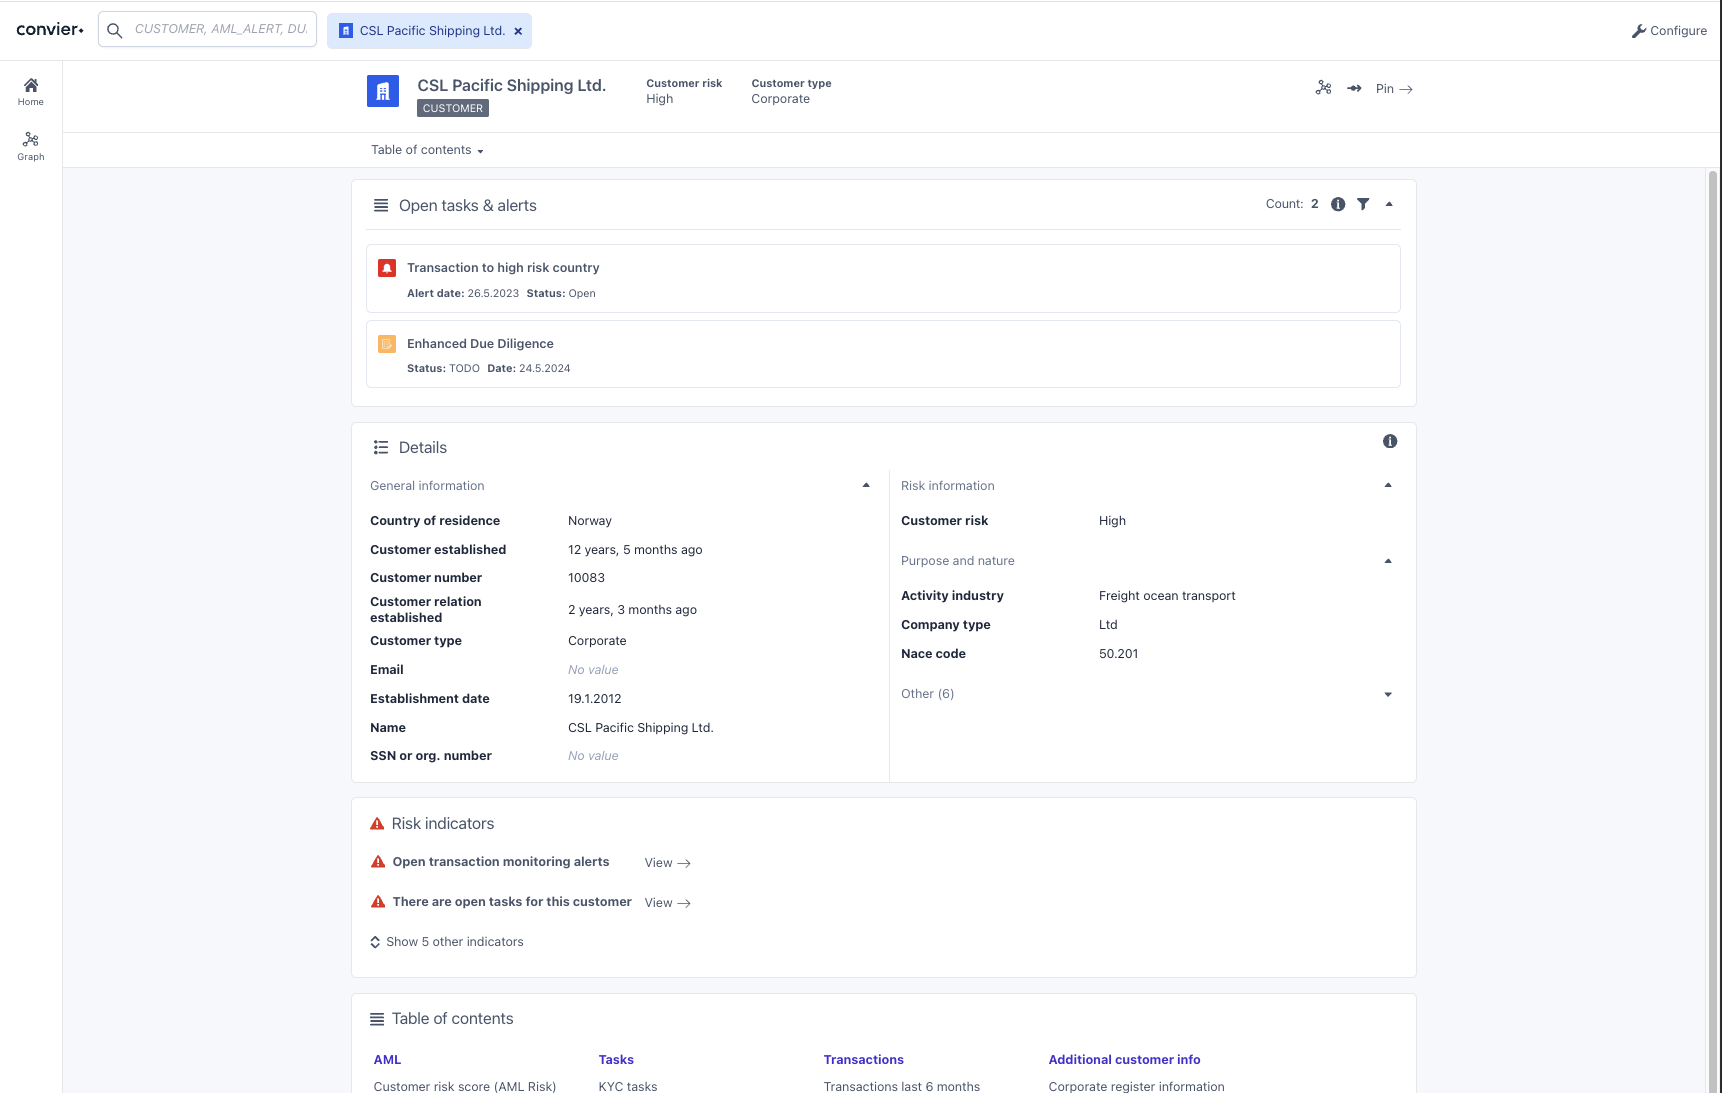
You can now see the most relevant information related to a customer, case or alert as a promoted chart on the object view front page. This can be useful for displaying information like open tasks on a customer, analysis guidelines for a transaction alert or the latest transactions on a bank account.
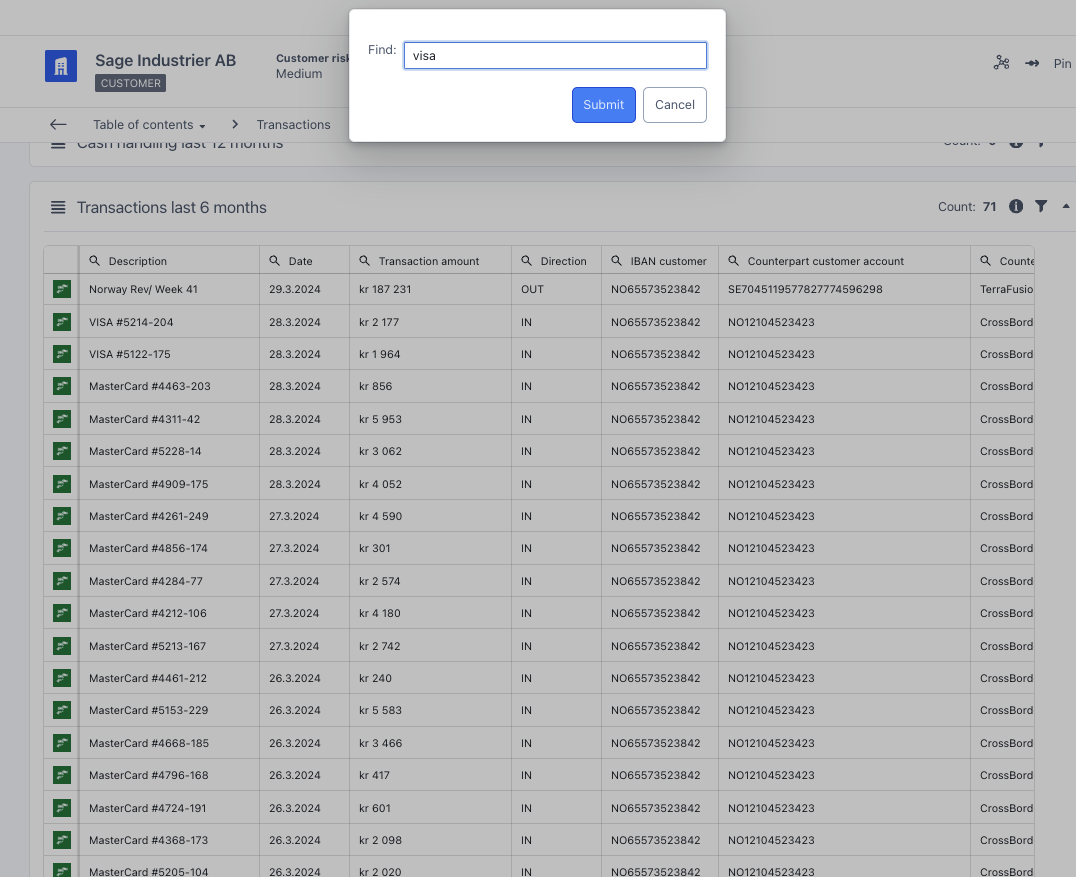
Filter data in table charts
Filter data in a table by clicking the magnifying glass button in the column you would like to filter on. Click the “clear” button (✨) next to the magnifying glass to remove the filter.
 \
\ 
Updates for admins
Promoted charts config
To place a chart on the front page of an object view, simply go to configuration mode and click the star symbol on the desired chart. Maximum one chart can be promoted on each object view.
Version 0.2406.2
Updates for users
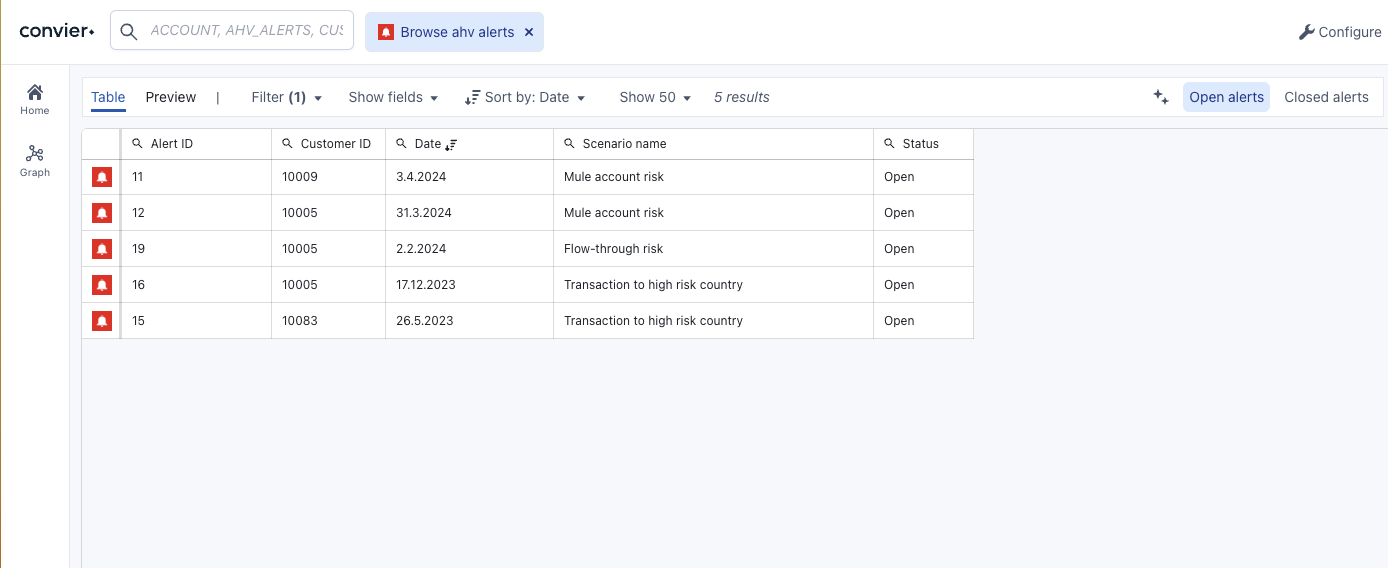
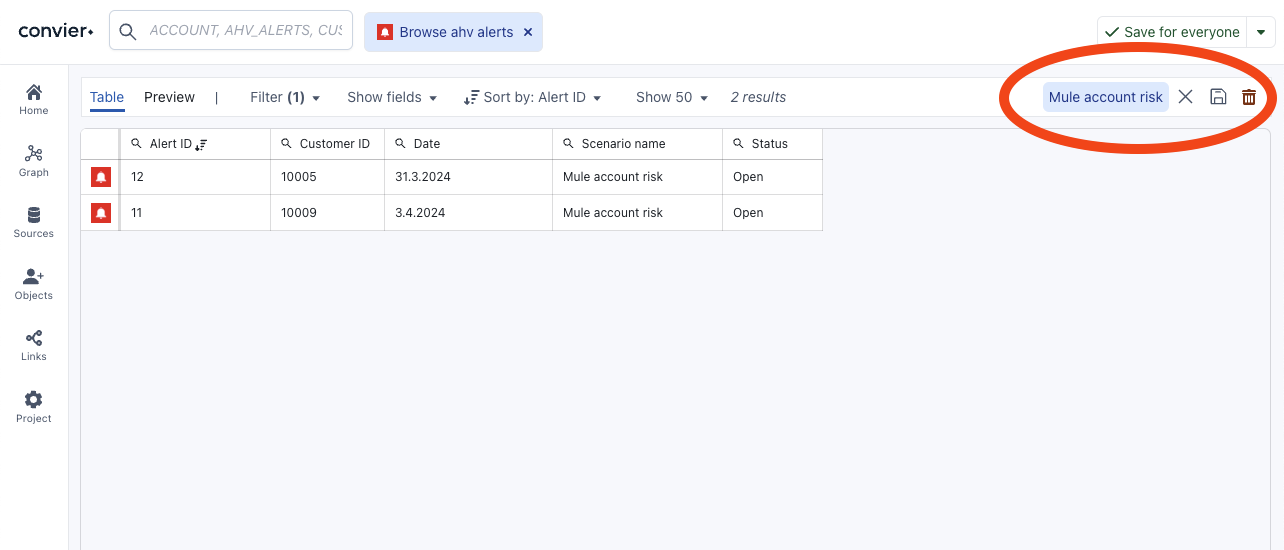
Saved views in Browse
It is now possible to save specific filters as a saved view under the “Browse” view. Simply click the name of the saved view to apply the predefined filters and sorting. Click the clear button to remove all filters and go back to default sorting.
 You can store multiple saved views for each object type
Updates for admins
Configure saved views in Browse
Set up saved views by going into Configure-mode, selecting the filters and sorting you want to save and click “Save view”.
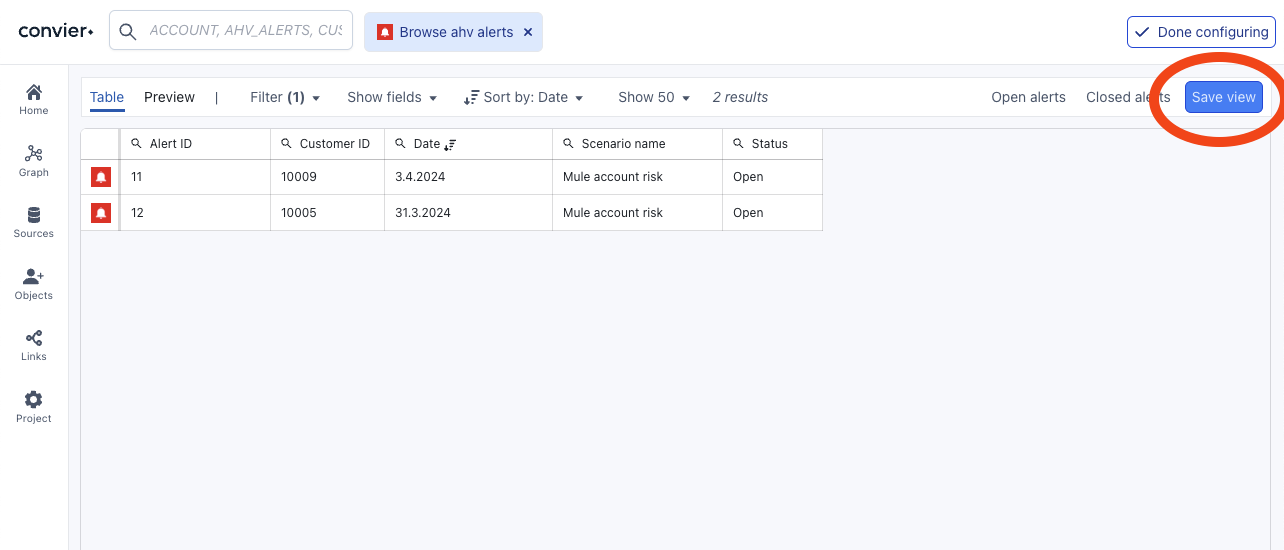 Store the current Browse view by clicking “Save view”
Each stored view can be edited by clicking the desired view, changing the filtering/sorting, and then clikcing the “save” button next to the view name. Click the “X” to stop editing the current saved view.
 Saved views can be edited or deleted when in configuration mode
All configured saved views will be visible for all users of the project.
Bugfixes
Fix bug in value comparisons for Risk Indicators
A bug in value comparison functionality would previously render wrong results when trying to compare an integer number to a number stored as string in the database. The platform will now attempt to cast the value from the database into the same data type as the specified comparison value.
Version 0.2403.2
Updates for users
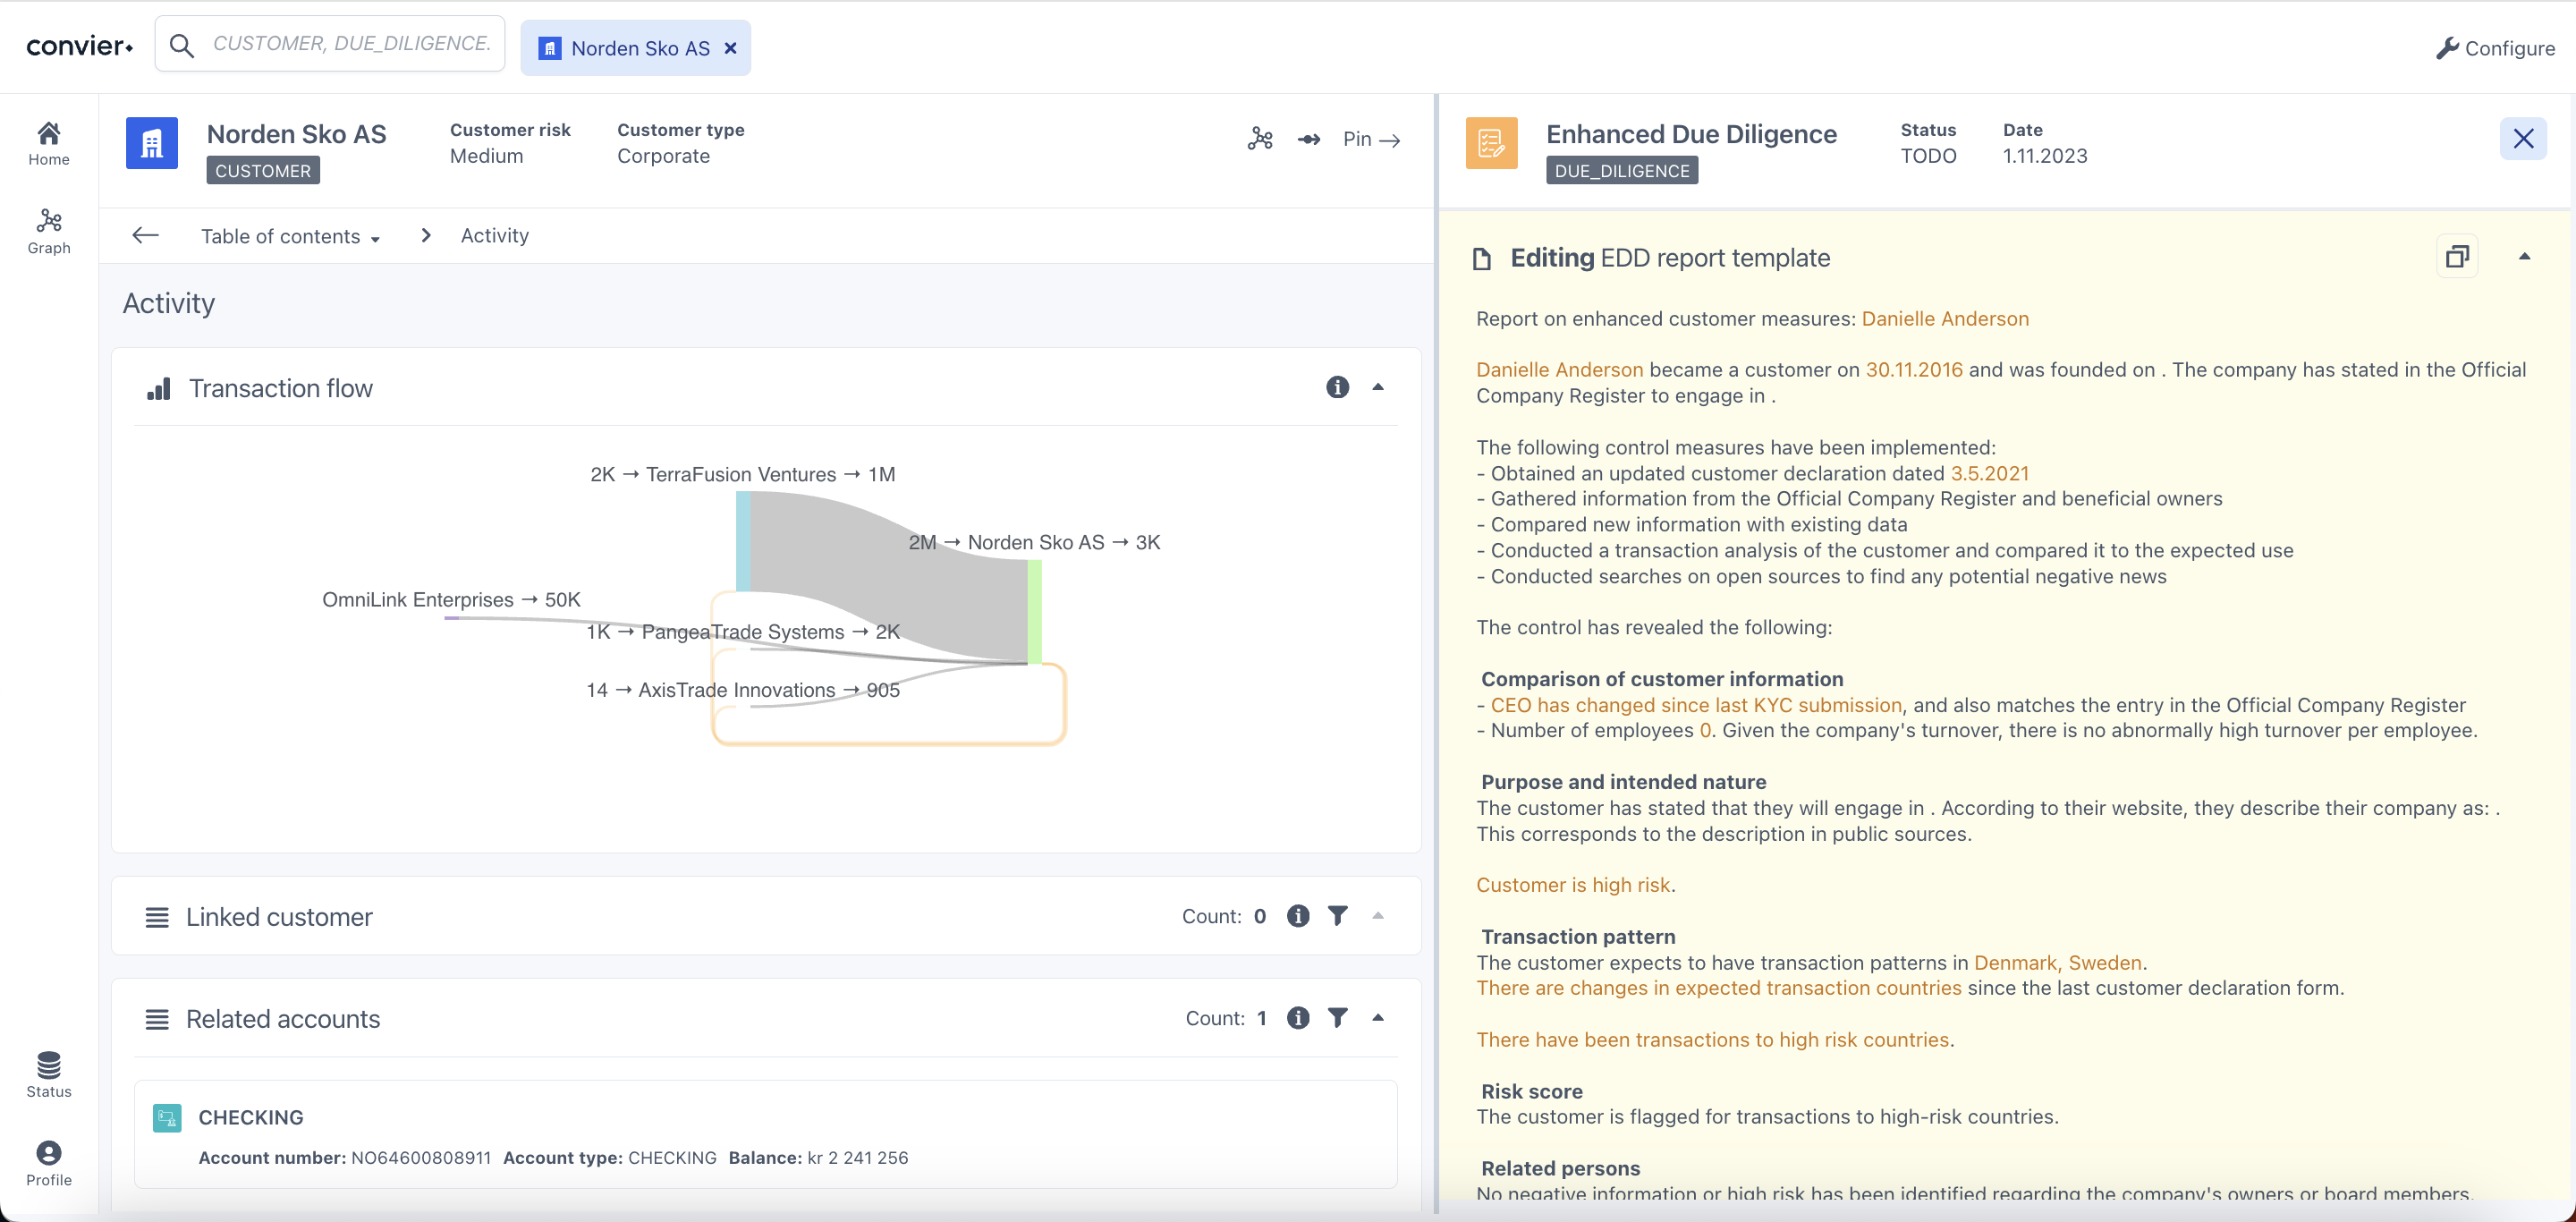
Report editing mode
Report templates can now be opened in editing mode in the sidebar. Simply click the “Edit in sidebar” button on the report widget and start writing. Note that since data cannot be stored in Convier, the edited text must either be stored to a connected datastore (like a CRM system) or copied to the clipboard before closing the edit view.
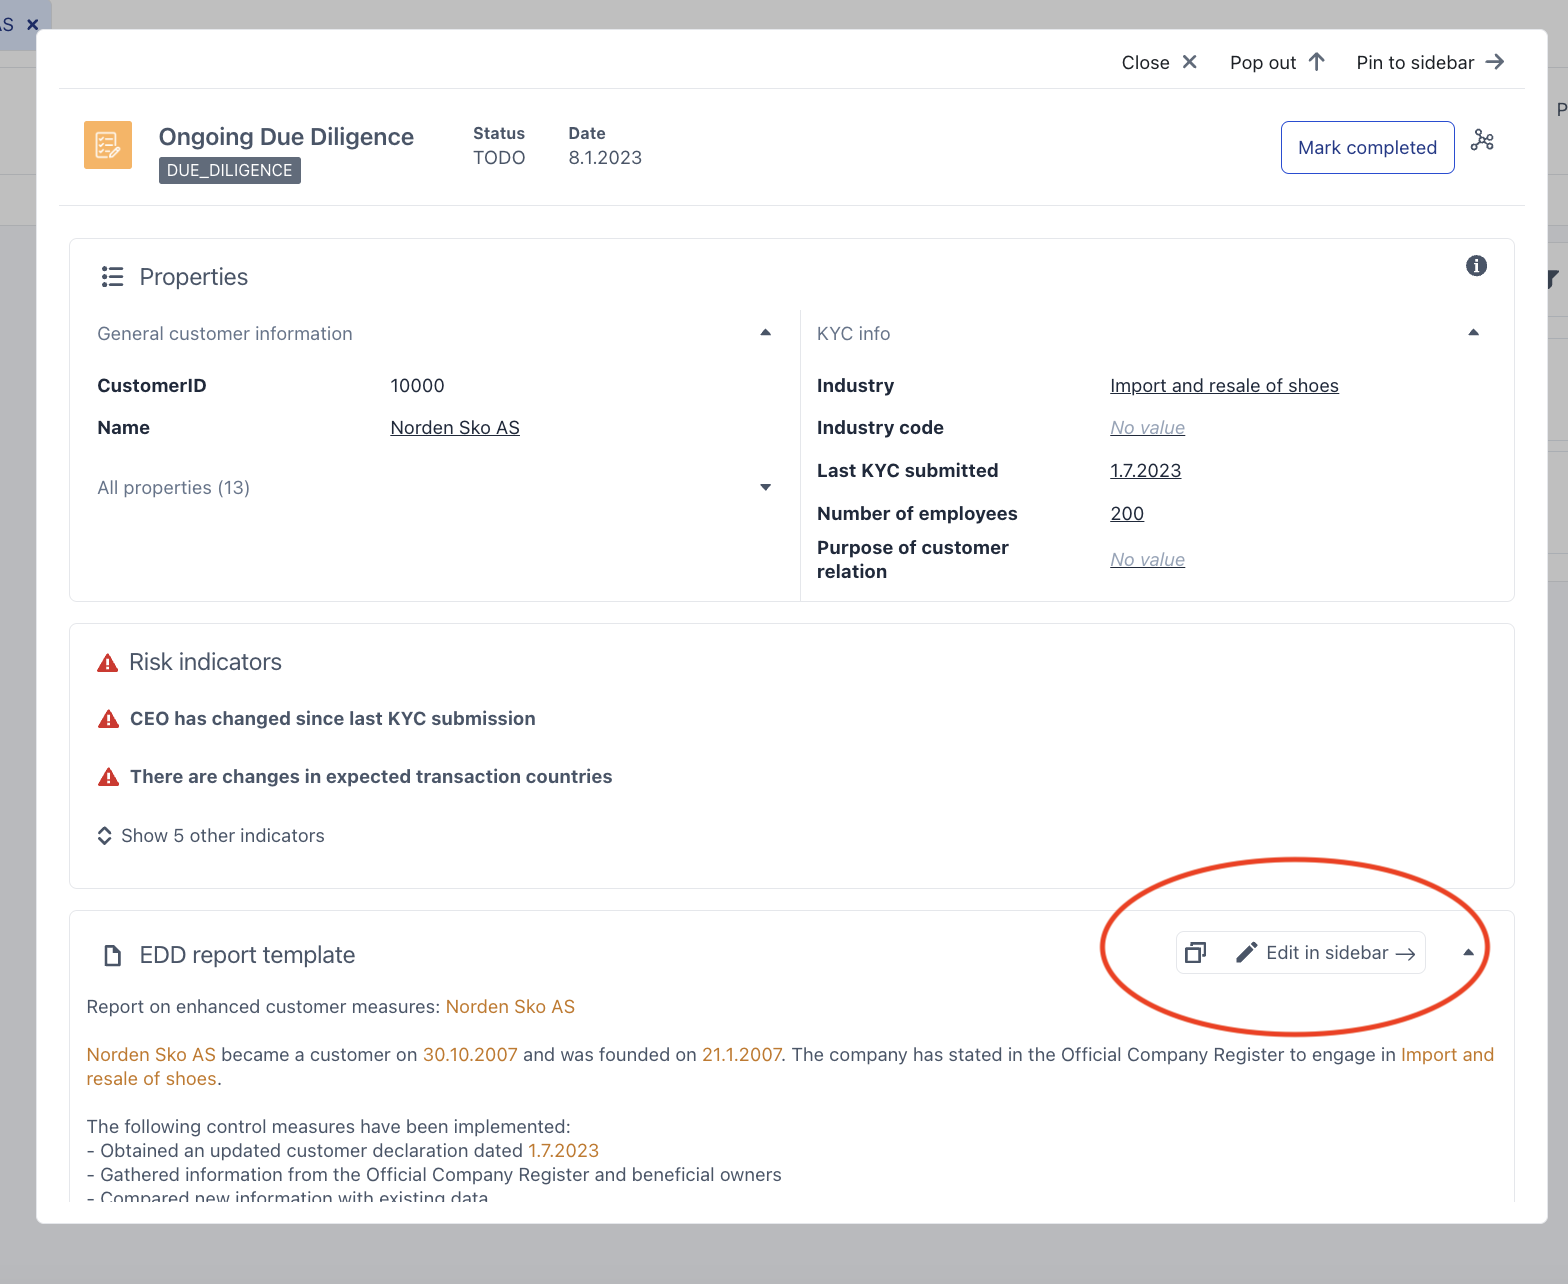
 Click the “Edit in sidebar” button to make the report template editable in the sideview.
Updates for admins
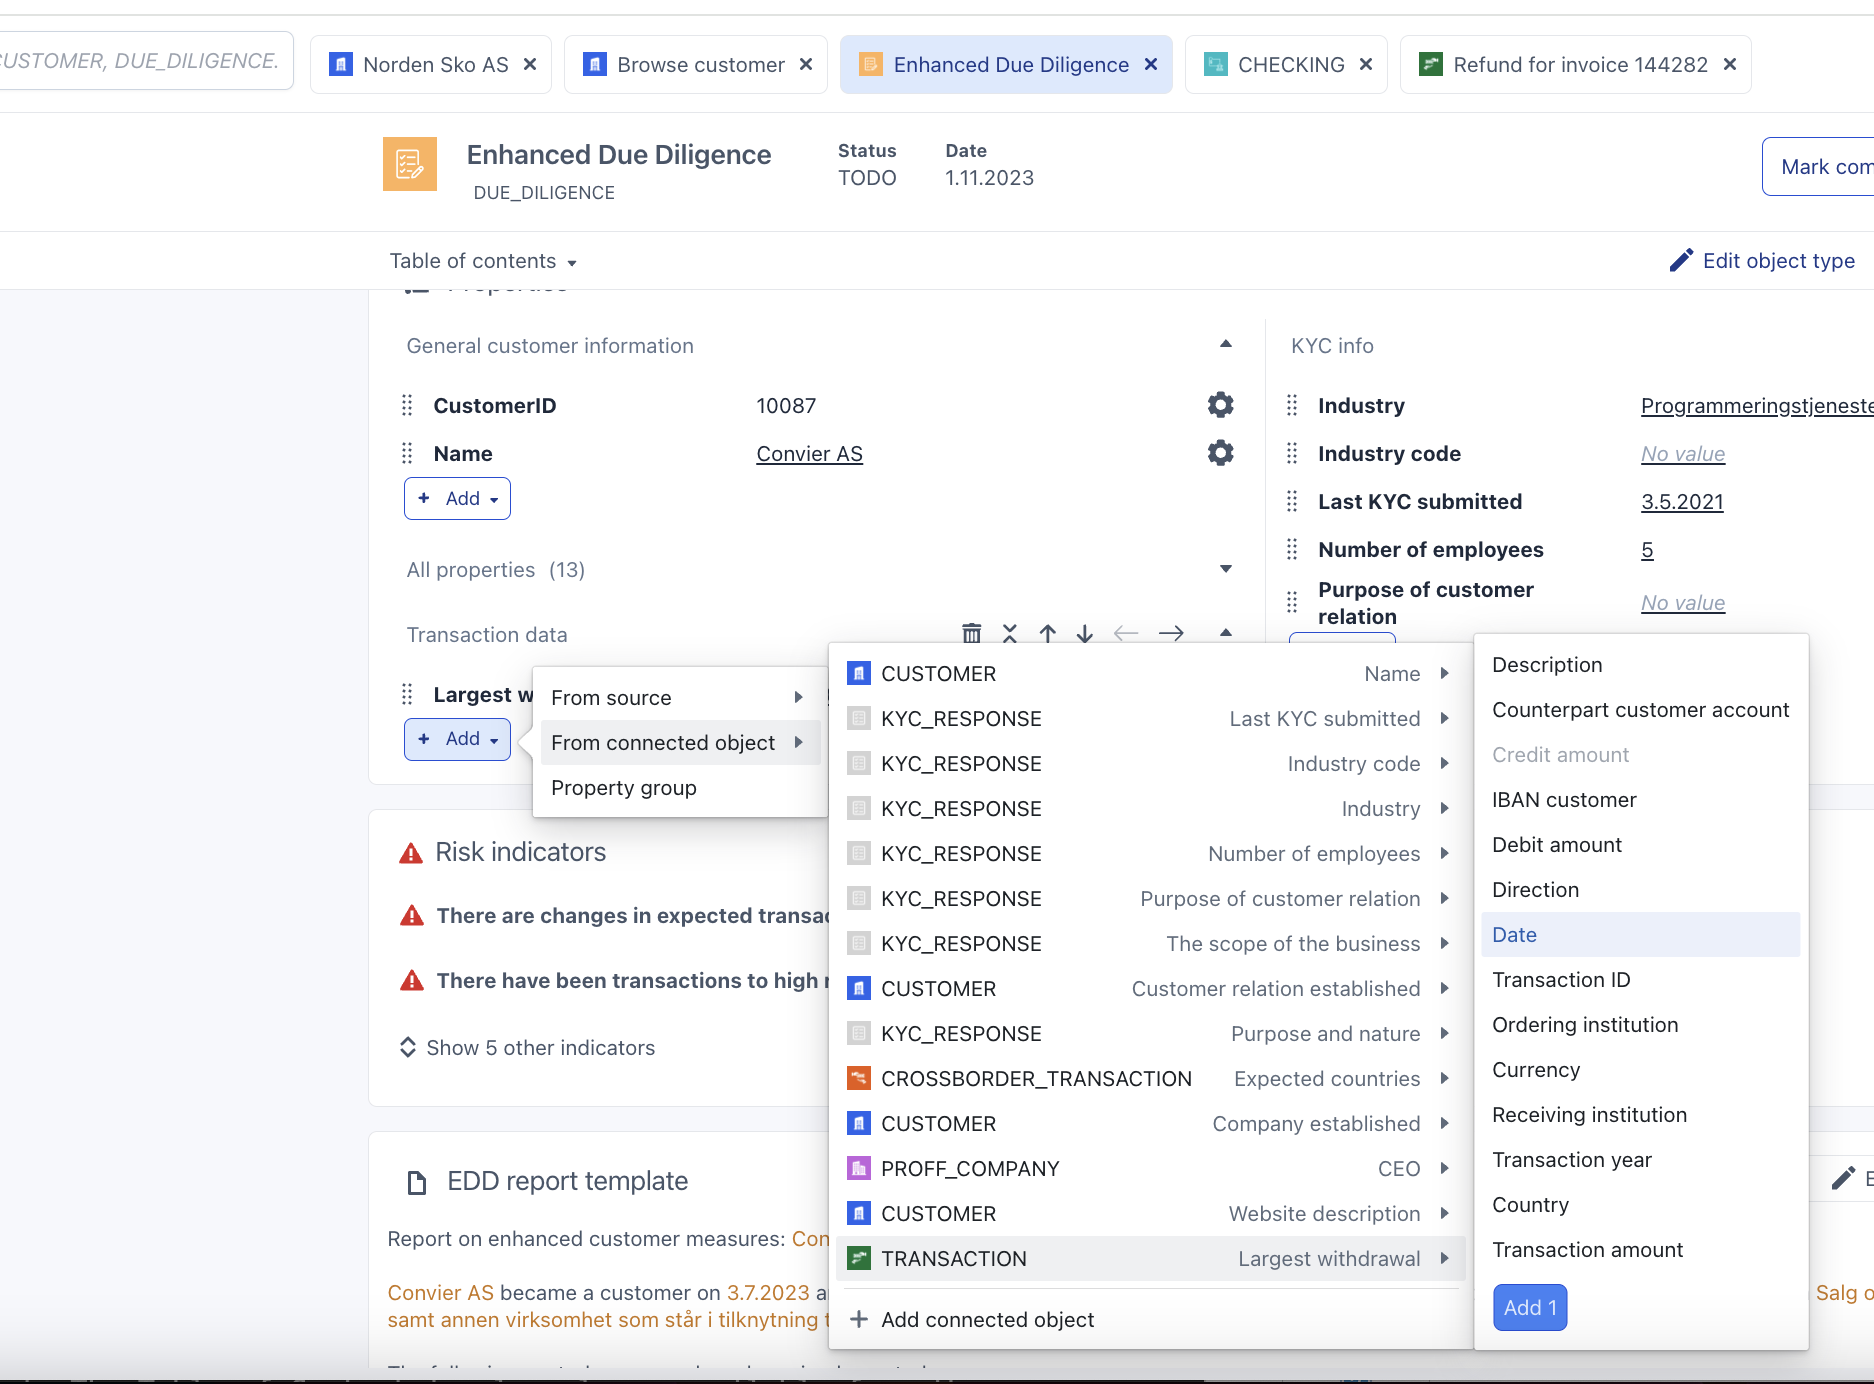
Bulk-add connected properties
Adding properties from a connected object is now faster an easier. Once an analytic has been set up to retrieve a property, other properties from the same object can be added with a single click. Start by retrieving the correct object by clicking “Add connected object”. The “Add from connected object” popout menu will then contain a quick-reference to the same object, so that multiple properties from that object can be added.
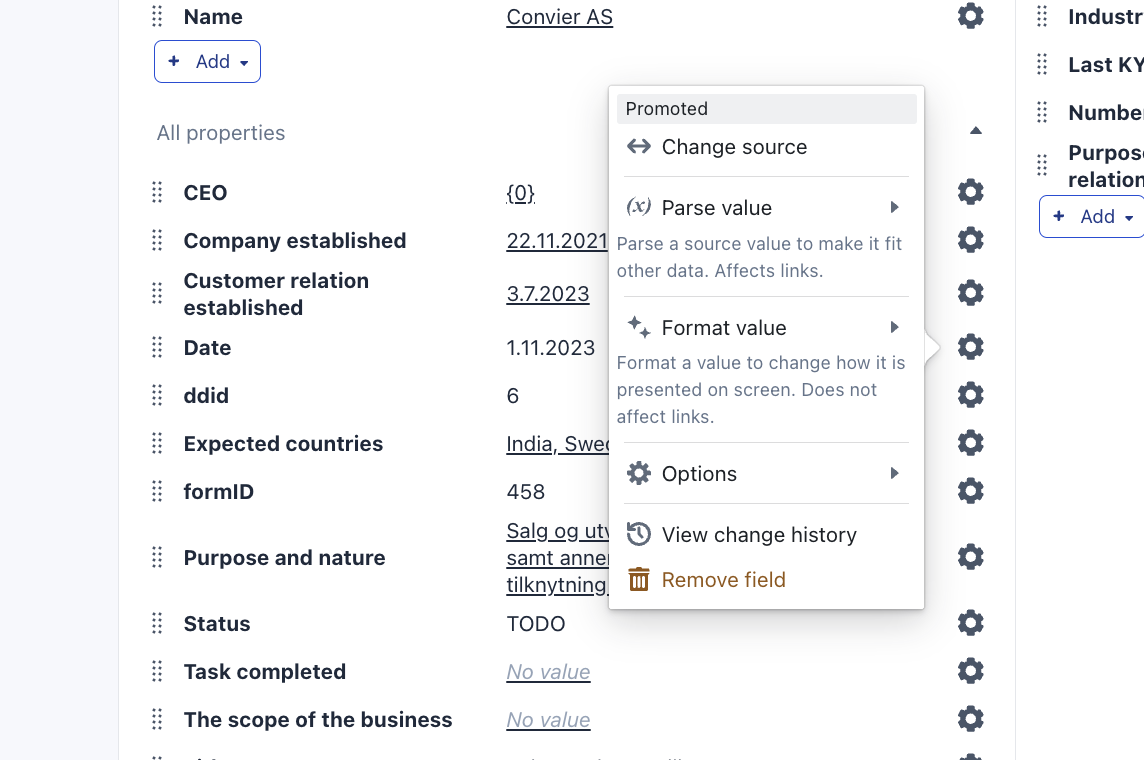
New formatting and parsing user flows
The options to parse and format properties have now been more clearly grouped into two configuration categories. All parsing operations (e.g. search/replace or JSON parsing) will affect the actual value of the property, meaning that the parsing config will affect how properties match other values in object links. All formatting options (e.g. date or currency formatting) only exist for presentation purposes, and will not affect the value used for linking properties.
Note that formatting options such as “Replace values” now can be used on data that has already been parsed (e.g. JSON data).
Version 0.2403.1
Updates for users
Pages in object view
The Convier object views are now devided into sub-pages, making it possible to collect related information and data in purpose-built page views. The front page contains a Table of Content with links to all sub-pages and charts related to the object. The Table of Content is also always available from the
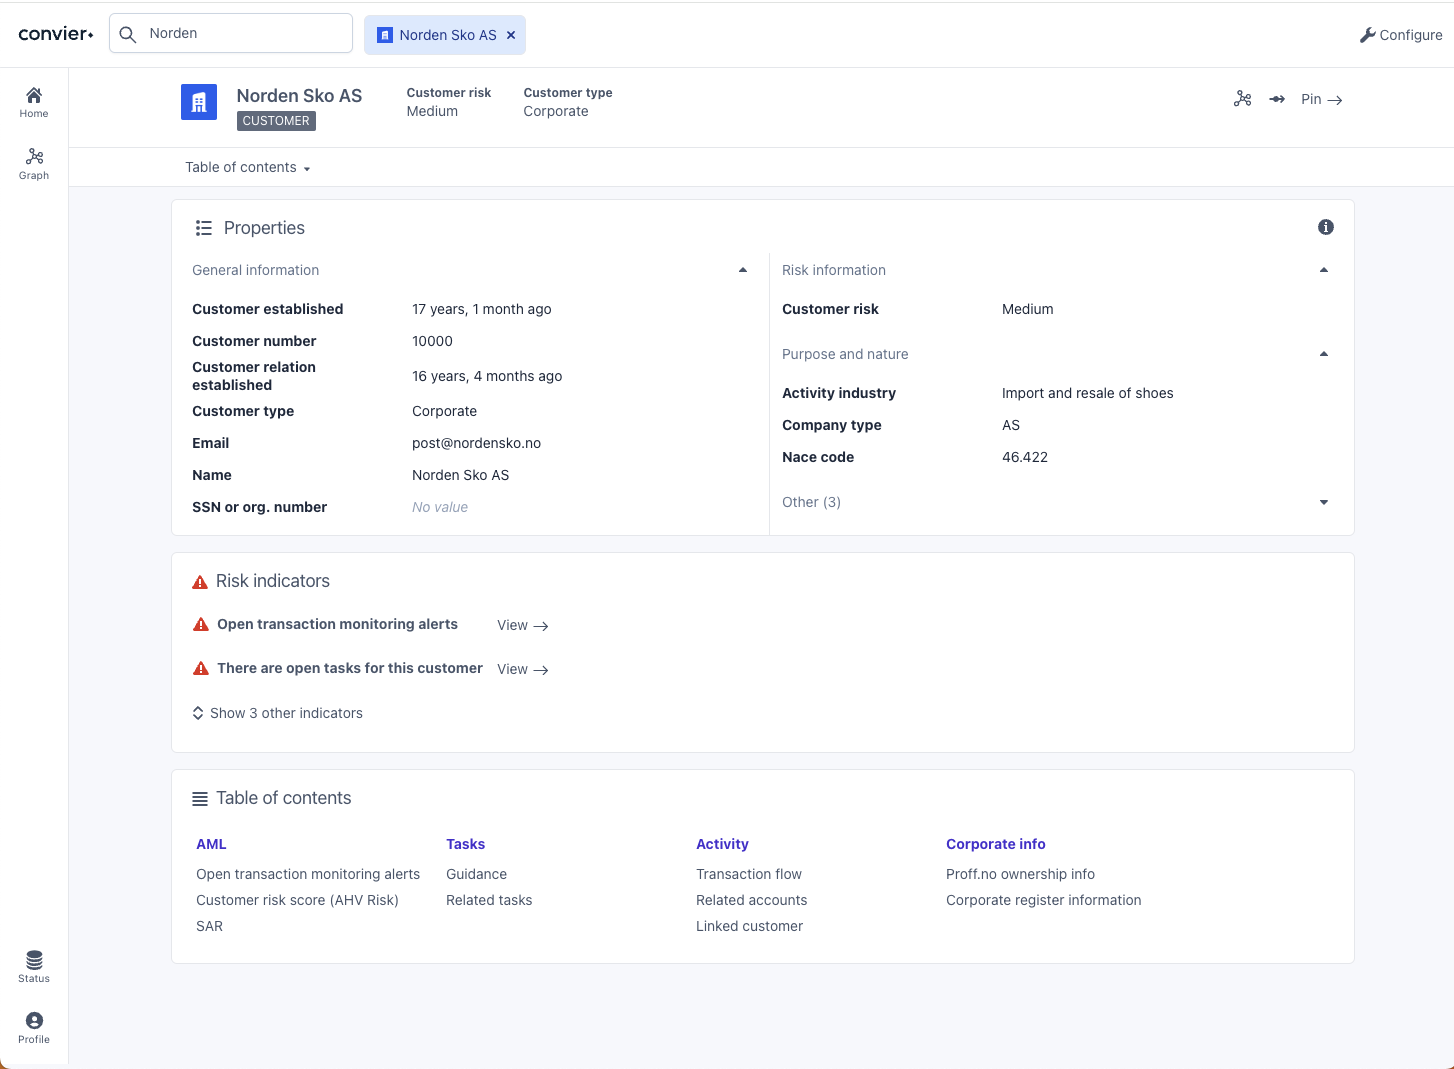 The object view in Convier is now divided into sub-pages. Charts can be opened from the Table of Content.
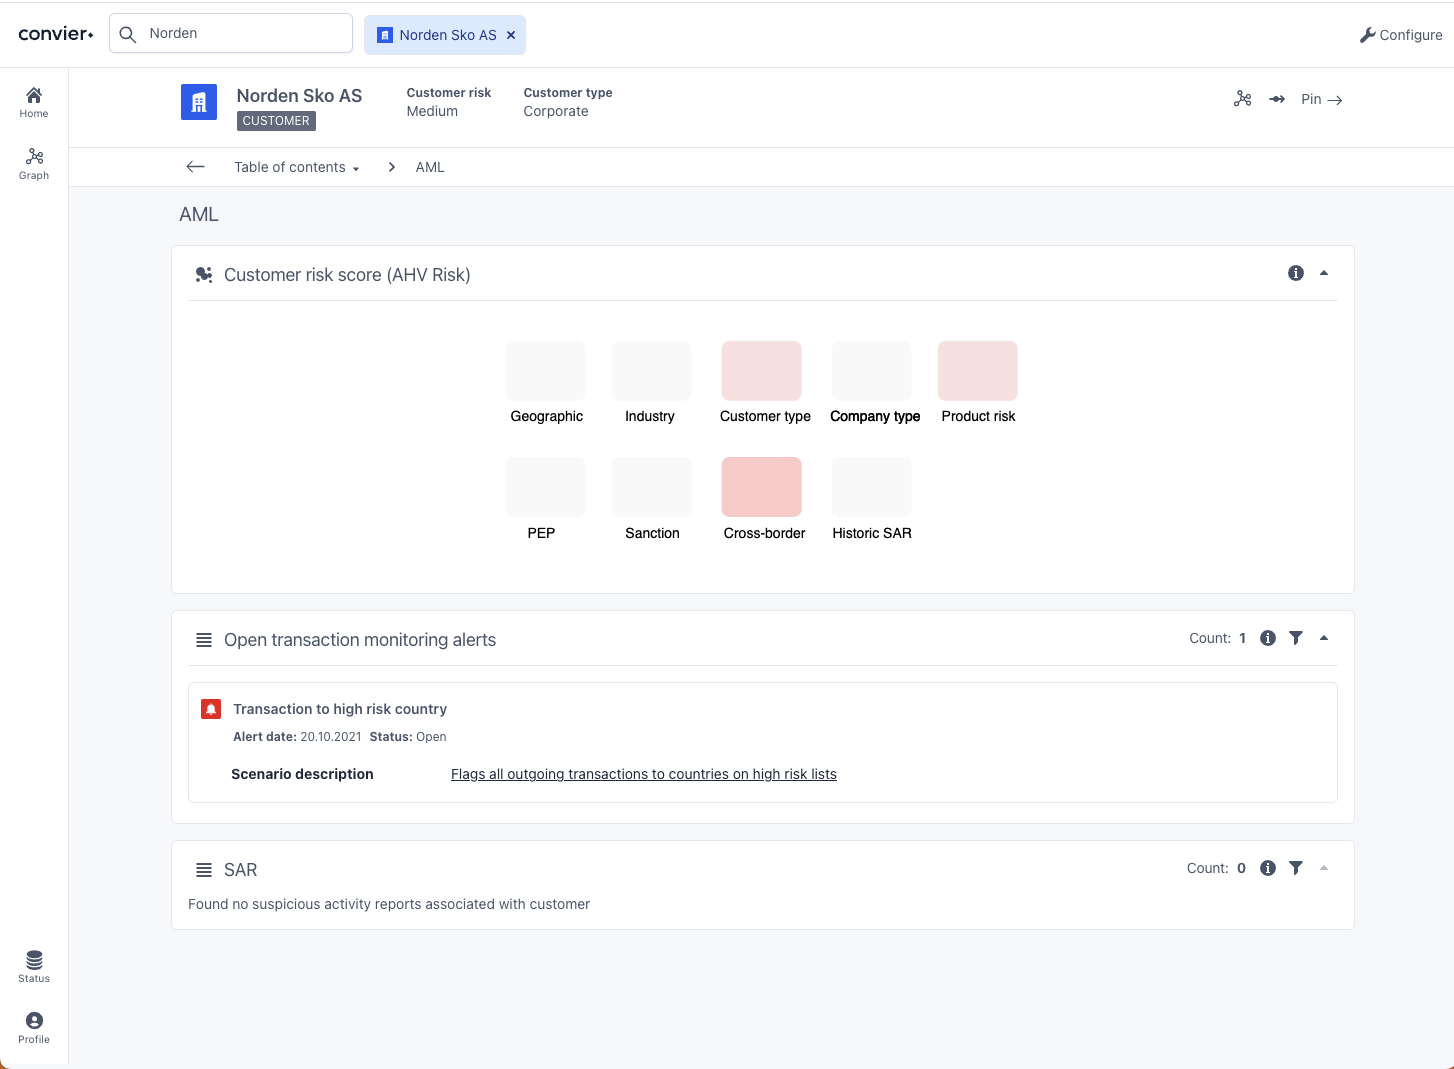 An example of a sub-page containing information relevant for AML risk scoring
The Table of content is also available from the object header bar, making it easy to access from any sub page.
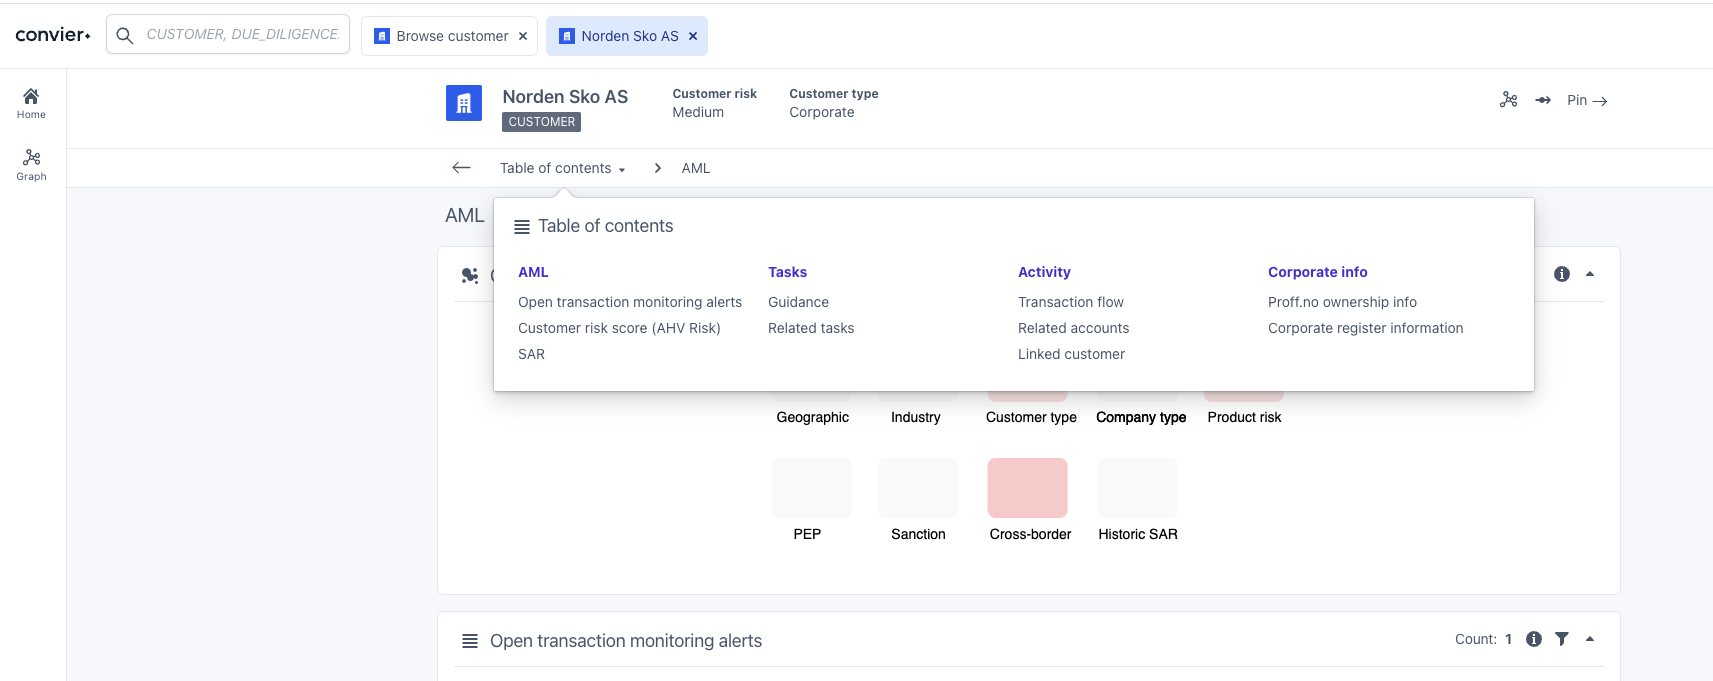 Reach the Table of Content from anywhere inside the object view
Updates for admins
When editing a project, the object lists will now include functionality to search and filter. You can search for the name of an object type, a table or source name.
New object lists in edit mode
 The new object list, allowing searching to filter the list.