The graph app
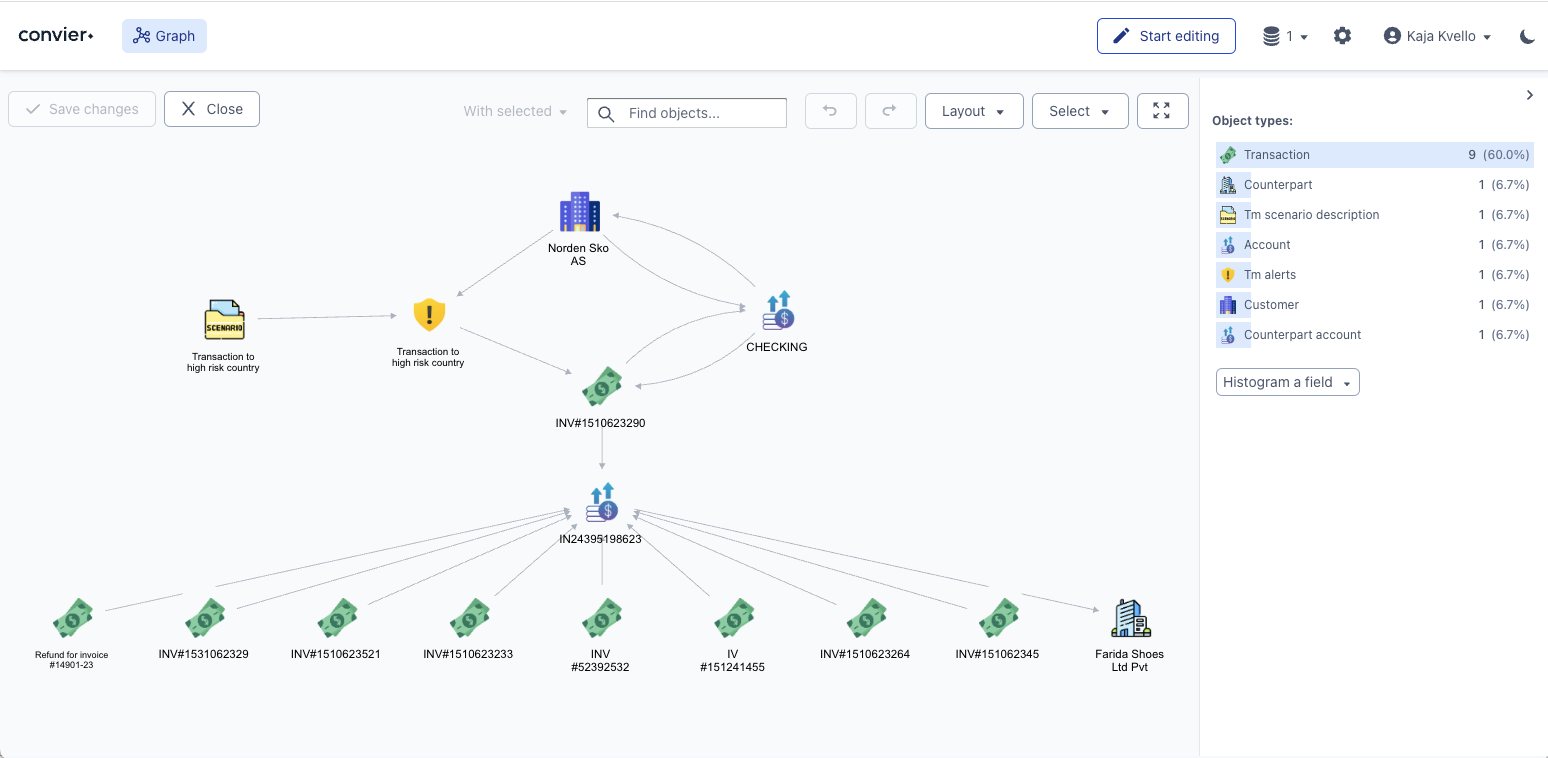
The Graph App enables users to visualize and analyze the relationships between customers, accounts, and other entities. Any data connected to the platform can be visualised in the graph. By representing data as nodes and connections, it enables users to uncover complex networks and patterns that are often hidden in traditional tabular data.
With the Graph View, users can:
-
Visualize relationships: The Graph View provides a clear and intuitive representation of how different entities are connected, making it easy to spot key relationships between customers, accounts, or companies.
-
Analyze networks: Users can explore a web of connections to understand how individuals or entities interact within the broader network, helping to identify potential fraud, collusion, or other suspicious behavior.
-
Map financial crime patterns: By showing the relationships between entities, the Graph View allows users to trace connections that may indicate organized financial crime or money laundering schemes.
-
Explore multiple layers of data: The Graph View helps users dig deeper into the data by allowing them to click on nodes and connections to reveal additional information, such as transaction details, risk scores, and historical activity.
-
Customizable views: Users can filter the data displayed in the Graph View, focusing on specific types of relationships, entities, or properties. This flexibility allows for more targeted analysis and better understanding of the network.
-
Whether users are investigating a single customer or mapping out a complex web of interactions, the Graph View provides the tools needed to understand the structure of relationships and detect unusual behavior within the data. It’s an essential feature for any investigator looking to uncover deeper insights into their data and discover hidden risks.
Organised views The platform offers pre-configured views to help structure and display data more effectively in the graph. By selecting a node and choosing the preferred view, the surrounding nodes will automatically reorganize based on the selected node. 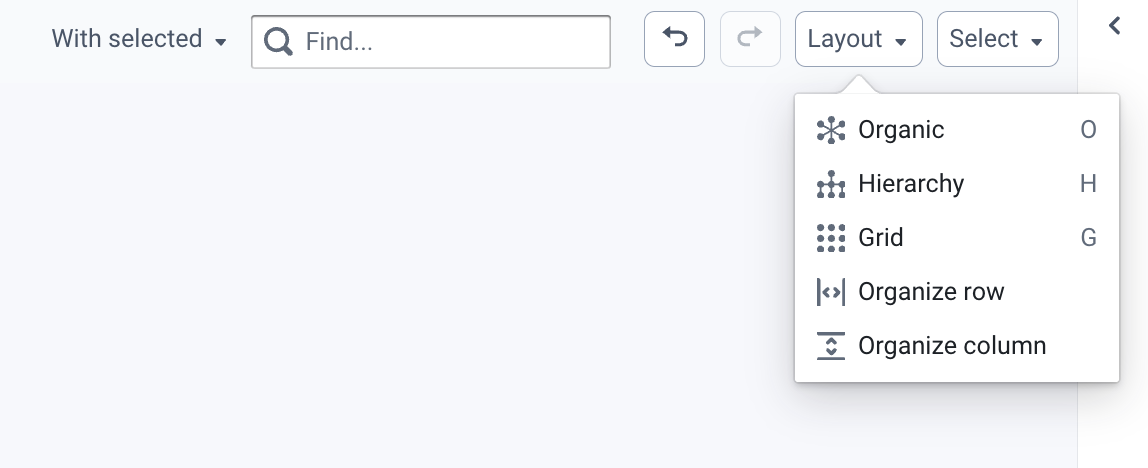
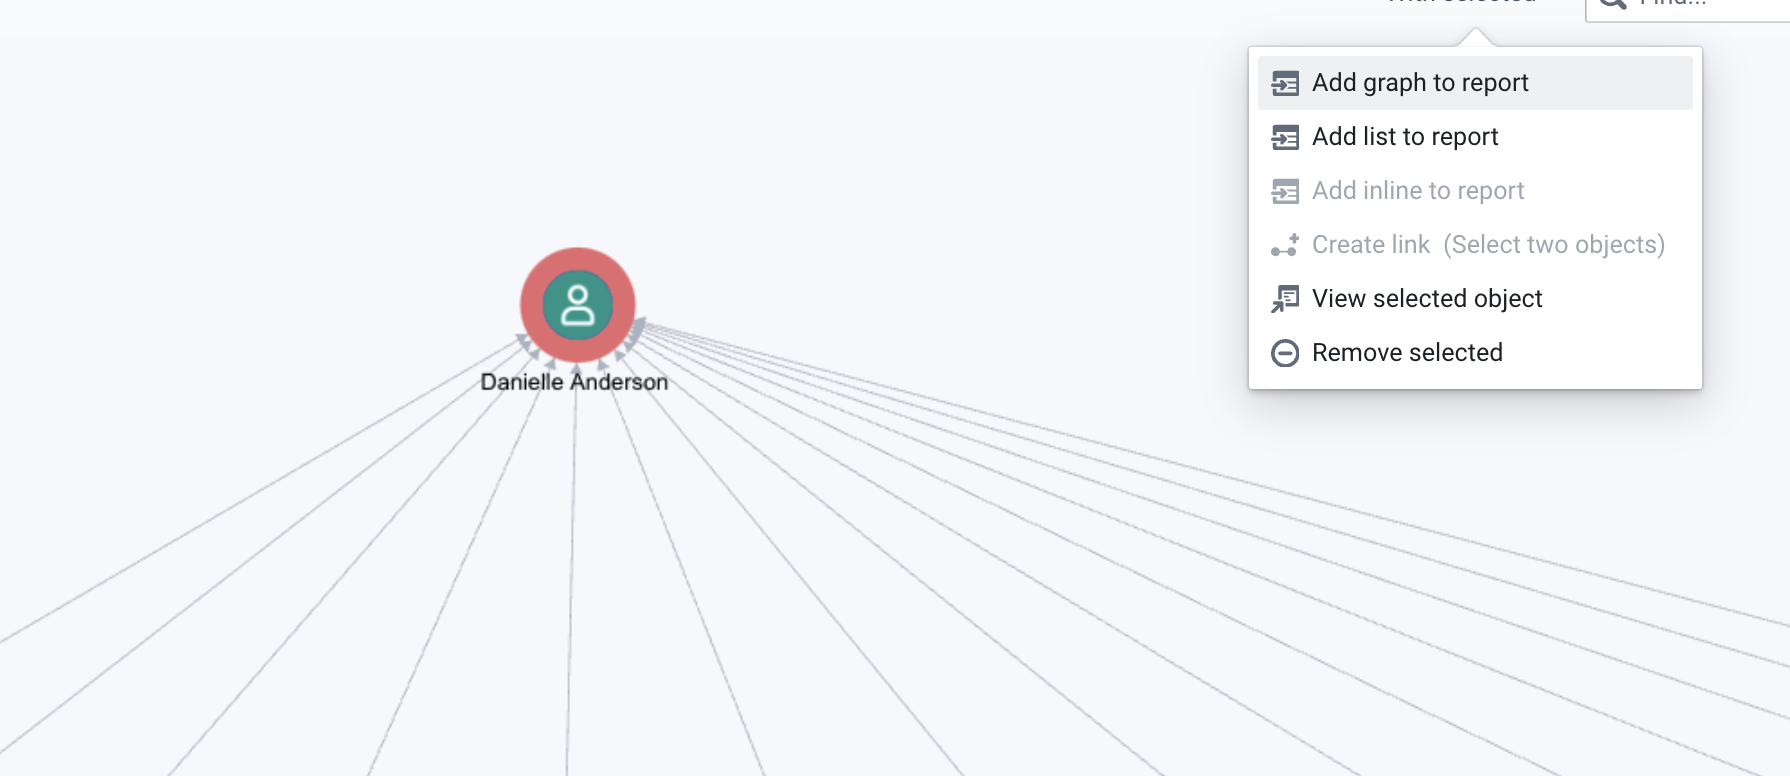
Save graphs to reports Graphs can be saved to reports. To save to a graph, you need to first open an editable field in a report (see reporting section). Once the report is open, select the nodes you would like to add, and click “Add graph to report”.