This is a consolidated version of the user documentation on how to use Convier as an end user.
File: Analysing data
Convier has functionality for exploring and analysing data in different ways, depending on the usecase.
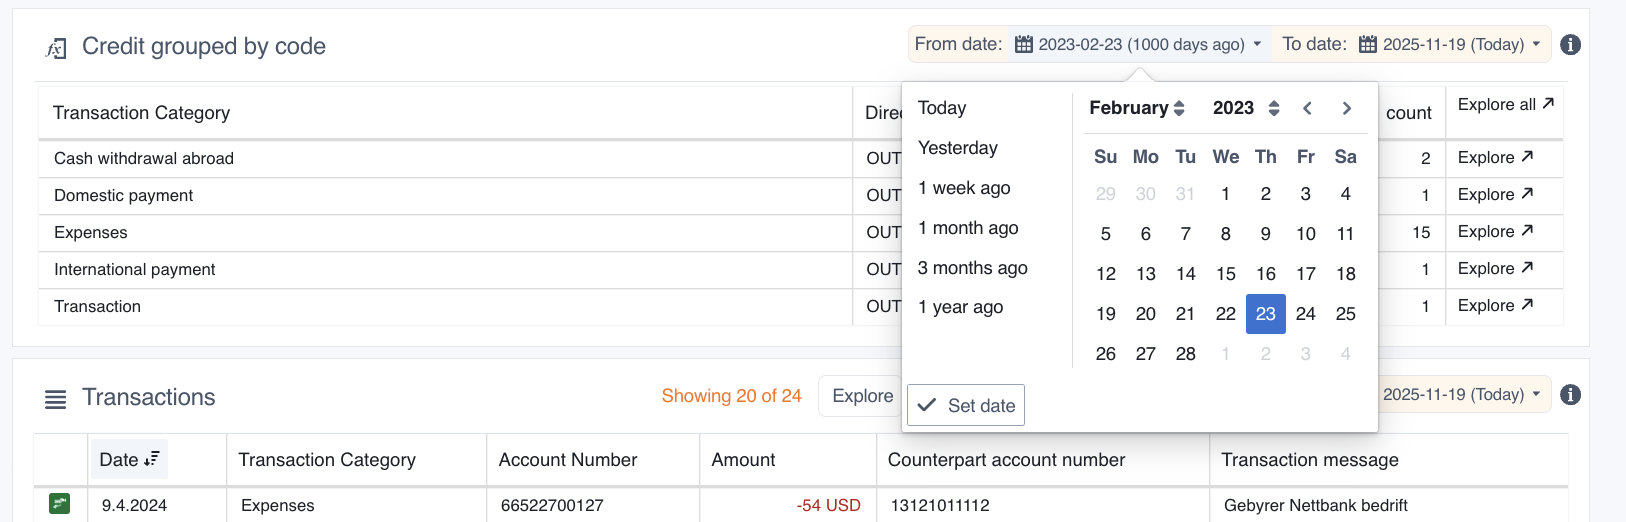
Certain charts and browse views in Convier will contain a date selector indicating the time range of the data it contains. Change the time range of loaded data by selecting a new date for the “from/to date” field. Note that chaging the date in one chart or view will affect the selected date range in other views in the platform.
Browse is a functionality which allows you to explore, filter and sort data in a table view. You can select what data to view in Browse mode by clicking the “Explore” buttons of a chart that contains the data you wish to analyse.
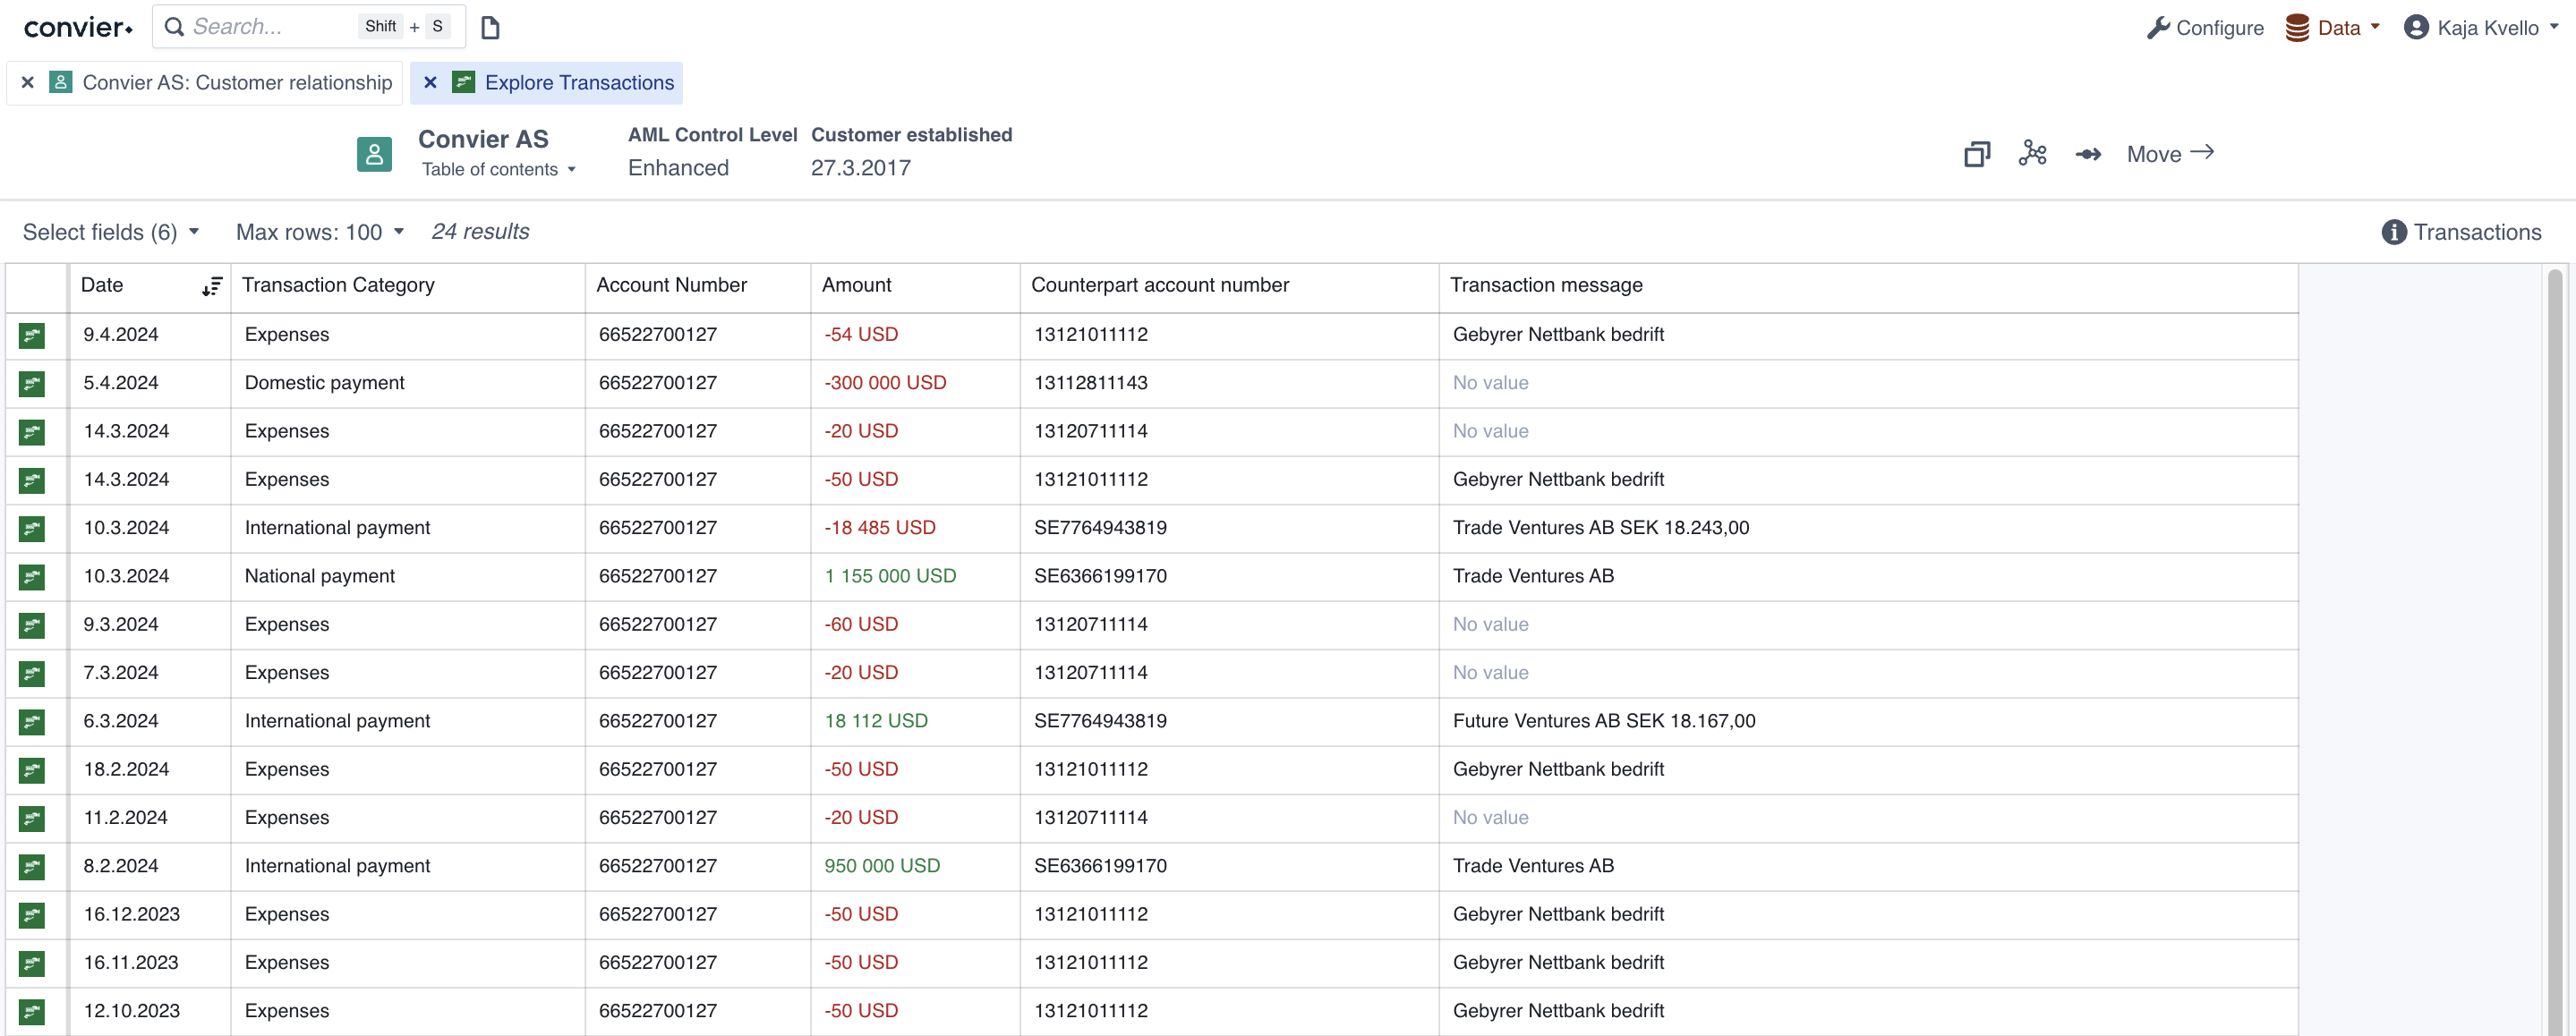
The top bar of the Browse view contains options for what, and how much, data to load into the Browse view. “Max rows” decides the maximum number of rows to load in from the data source. Be advised that loading a large number of rows might be slow. The top bar will also contain information about how many rows have been loaded into the current view.
“Select fields” allow selecting or un-selecting the columns displayed in the view.
Data in a table can be sorted by clicking the column header of the column you want to sort by. Clicking once will sort the data in ascending direction, clicking twice will sort in a descending direction. The sorting icon indicates which direction and column the table is currectly sorted by.
To filter the data in the Browse view, click the “Filter”-button in the column you wish to filter by. The filter dropdown will give several options for how to filter the table data. Add the desired filter(s) and click “Apply” to display the resulting rows in the Browse view. Columns with an active filter will be highlighted in yellow. To clear the filter in a column, click “Clear” in the filter dropdown.
 Filter about to be applied on the column “Transaction Category”, showing only transactions with category “Cash withdrawal abroad” or “International payment”
The filter options available:
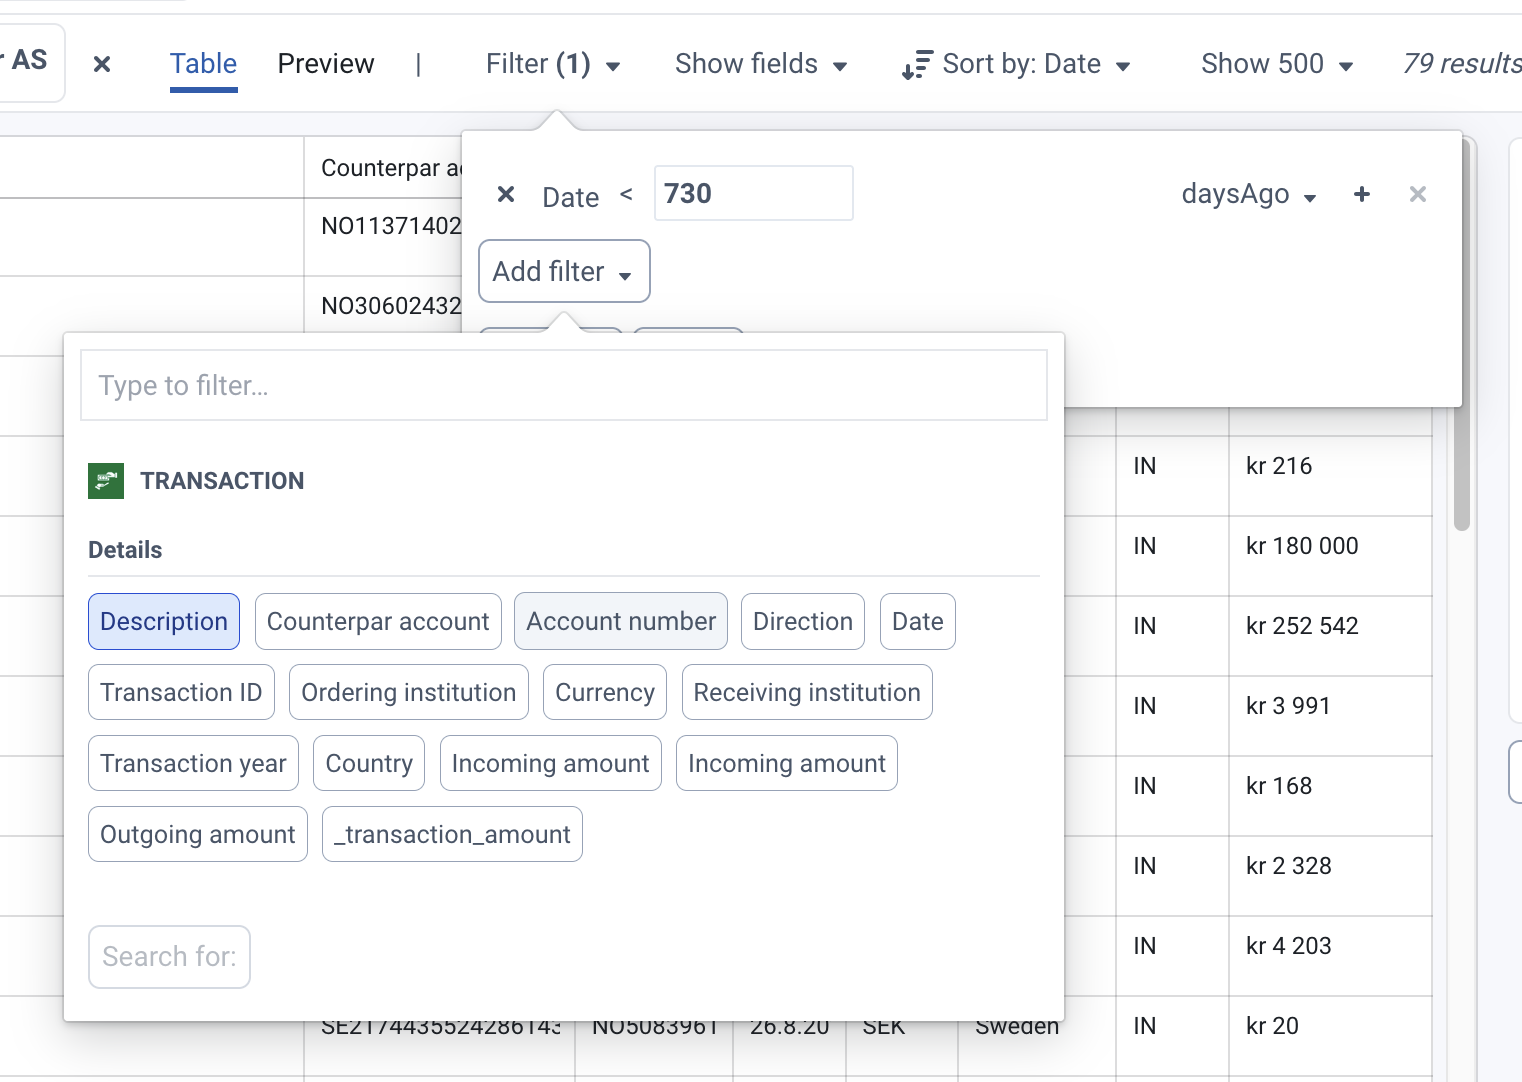
It is also possible to group data by a specific column, similar to how a pivot table works in Excel. To group the data, select “Group by” on the column value you want to group by. It is possible to select “Group by” on several columns to further divide into subgroups. To add sums of values in the grouping table, select “Sum” on the column you want to add the sum of. To see only the rows included in one group, use the Explore-button (arrow) on the desired group row. This will filter the Browse view to only include rows in the given group.
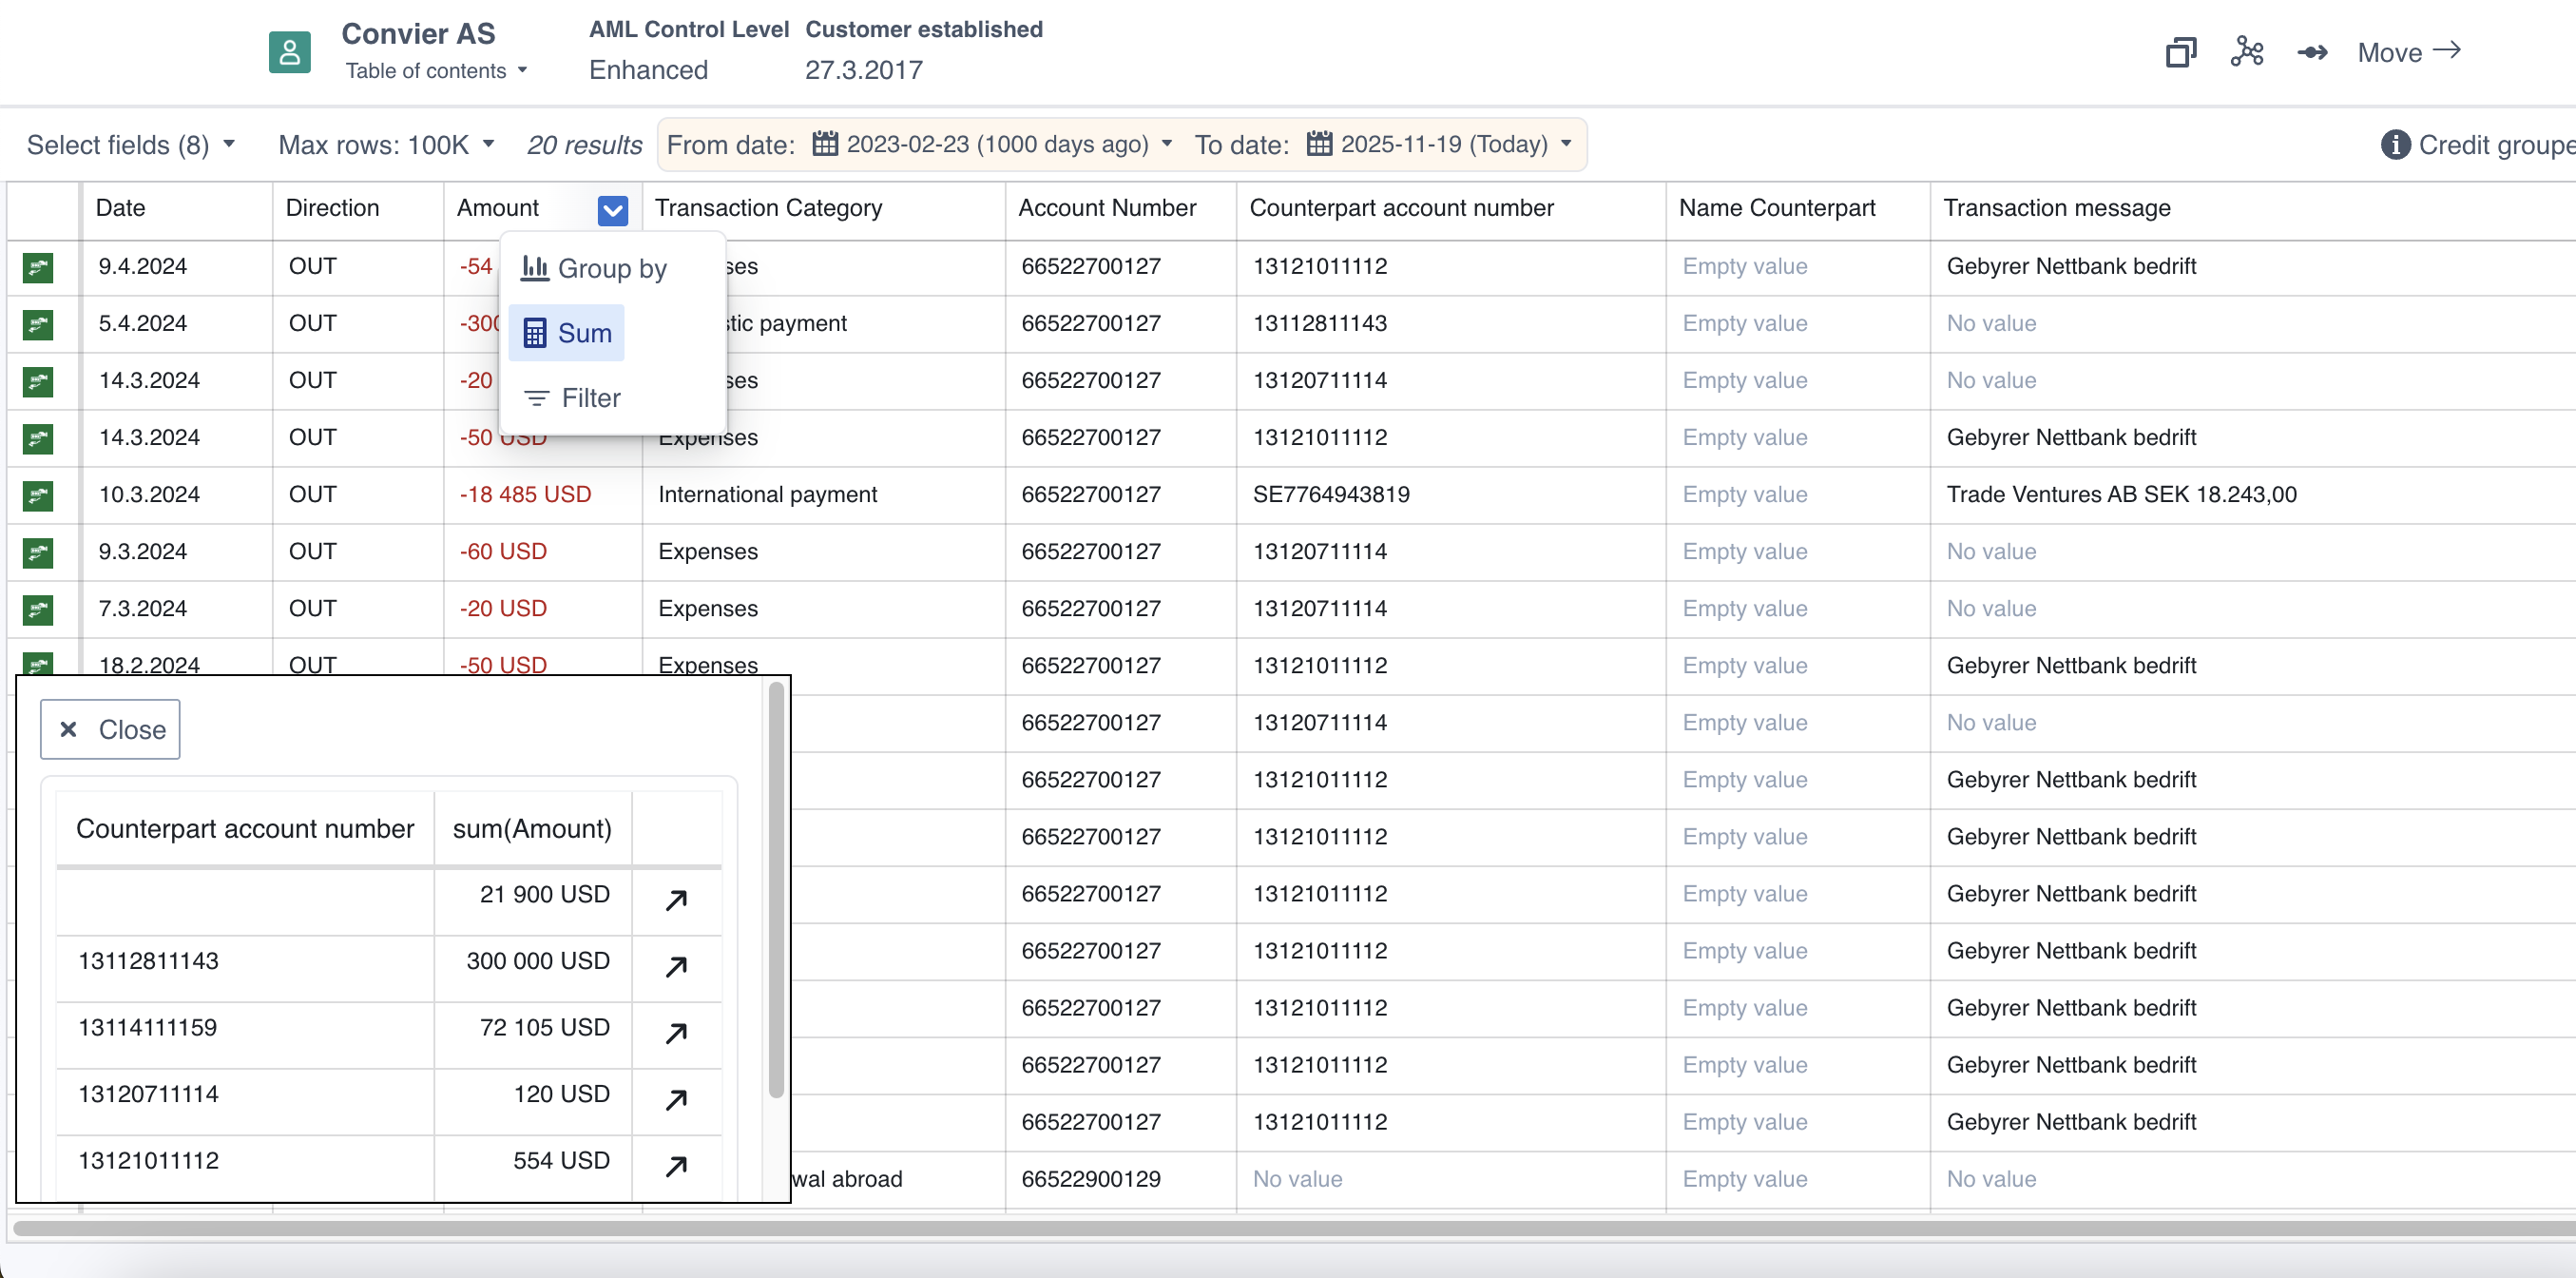 A transaction list grouped by “Counterpart account number”, with a sum of “Amount” added to the table
File: Concepts in the Convier platform
Convier connects data from distributed data sources (f.ex. internal databases, CRM systems or external API services) and meshes the data together into data views and documentation workflows. The platform consists of different functionality concepts for presenting and analyzing data, as well as moving through and documenting an analysis workflow. This section contains a description of the most important concepts in the Convier platform:
Data objects are at the center of the Convier data model. An object is the representation of some entity in a data set. An example of an object could be a customer, a bank account or a transaction.
To open the object view of a certain data object, you can search for the object, or click a link to this object from another view.
Objects consist of a collection of properties, containing data points descring the object in question. Examples of properties can be a customer’s ID number, a transaction’s amount or the date an account was opened.
An object view will contain all the available information related to some object. The below example shows the object view for a Customer.
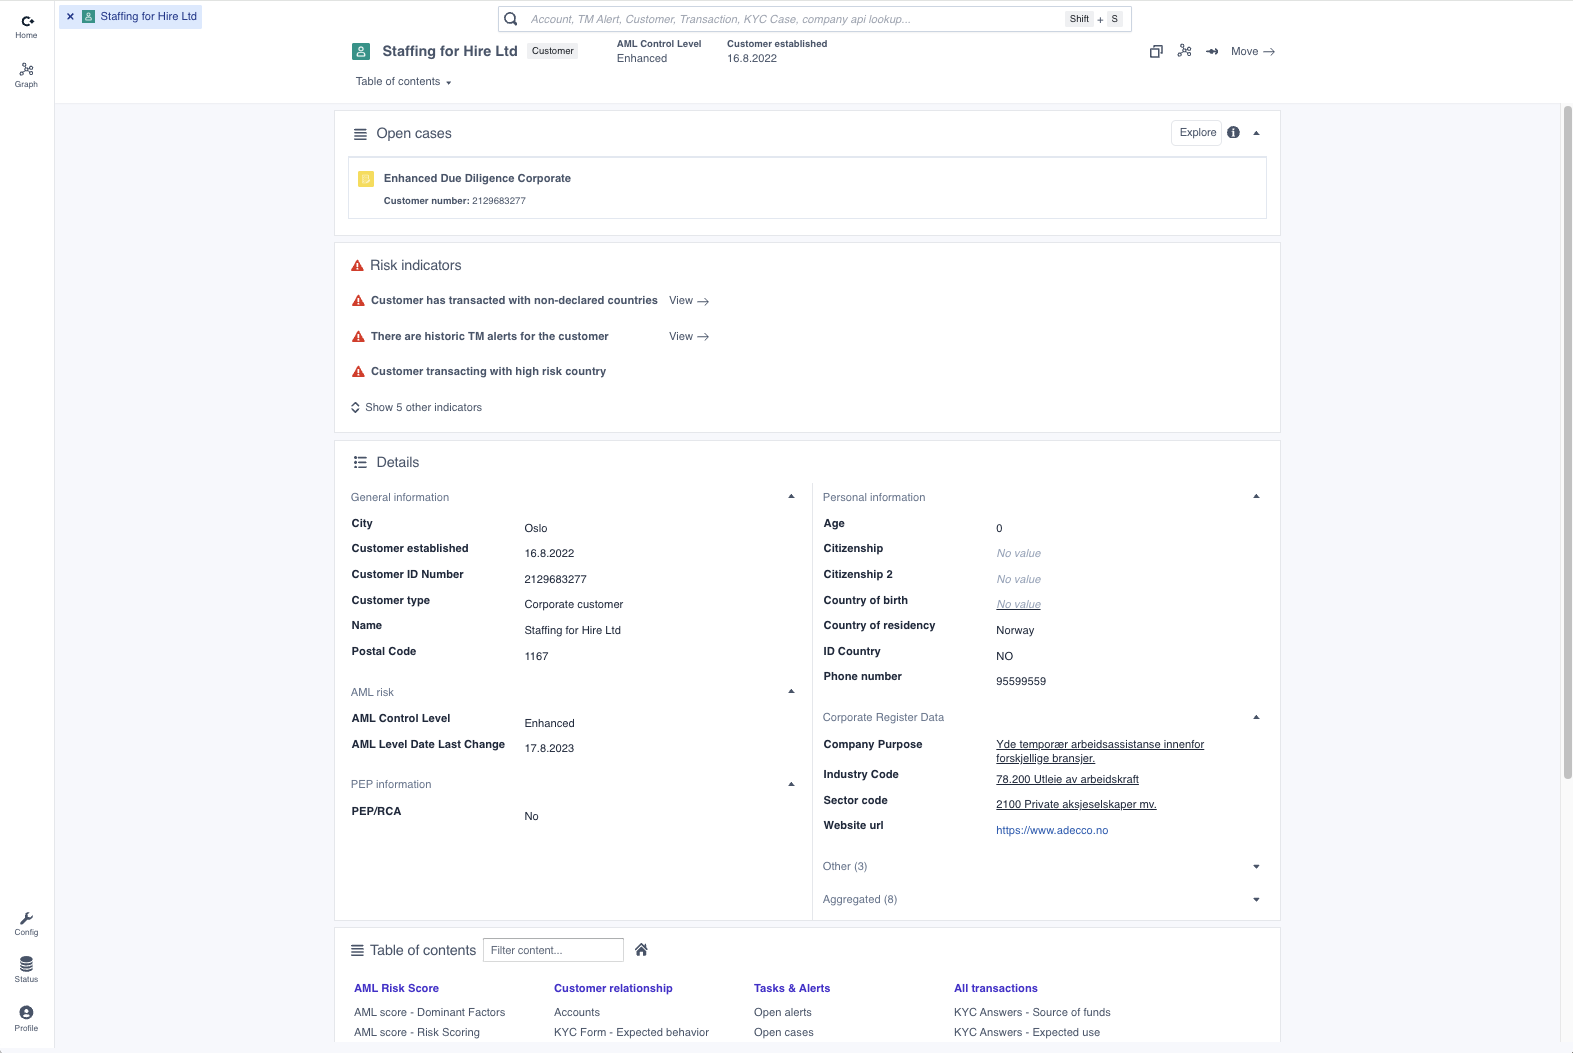 An object view for a Customer object
The object view typically includes the following elements:
Links is the underlying mechanism that represents relationships in the data connected to Convier. A link describes some sort of relationship between two objects. The link can exist between objects of the same type, or between different object types. Links can also exist between data objects from different origin sources.
Examples of a link between objects:
A chart is a way of visually displaying data retrieved by some pre-configured search. An example of such a search could be to start with a Customer object, find all linked Transaction objects and then filter to show only transactions from the last 12 months. Data in Convier can be displayed in one of the following chart types:
Object list chart
An object list chart shows a list of objects, including some key data points. To view more information about a specific object in the list, click the list element to open the corresponding object view.
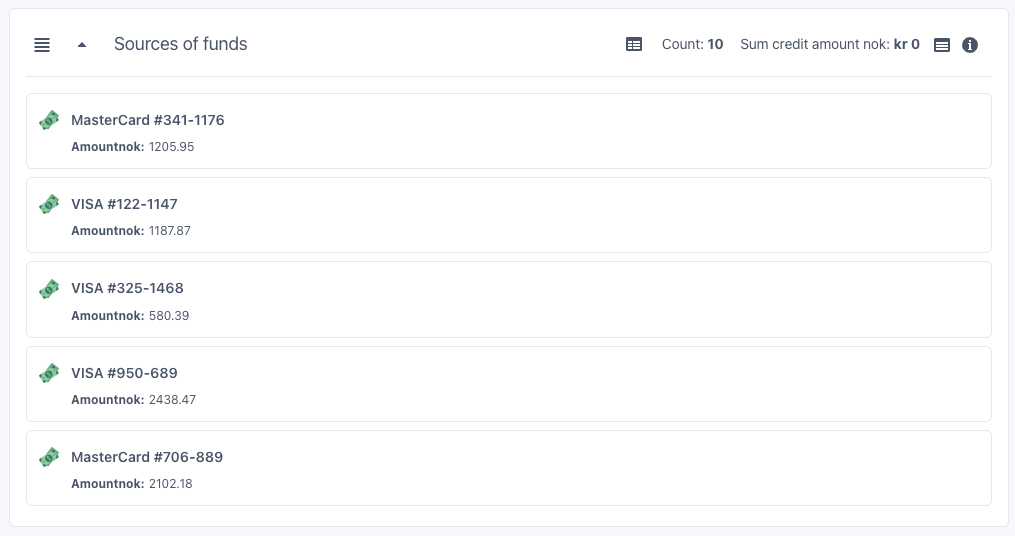
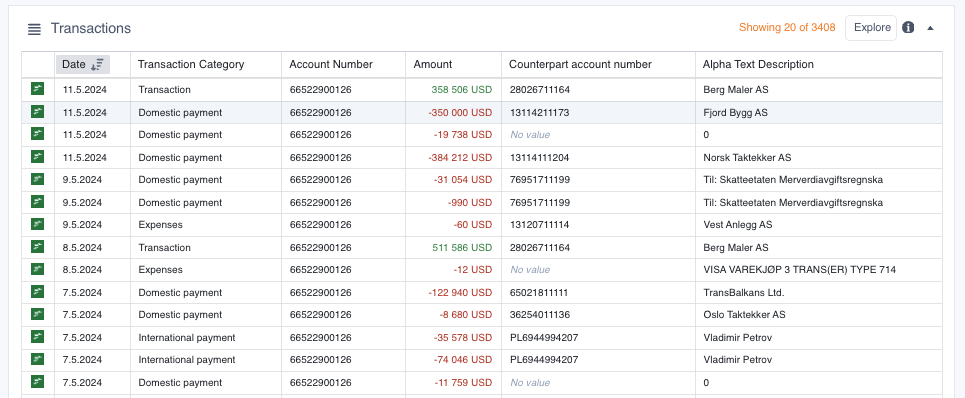
Table chart
A table chart shows a list of object data in a table format. To sort the data in the table, click the column header of the column you want to sort by. Clicking once will sort the data in ascending direction, clicking twice will sort in a descending direction. A sorting icon will indicate which direction and column the table is currectly sorted by.
The chart can be limited to show only a subset of all found objects, in this case the information text “Showing X of Y” will be displayed in the chart header. To see the entire list of objects returned by the underlying search, click the “Explore” button to open the Browse view. To see more information about a single object in the list, double click the row containing the object you want to investigate.
Aggregation chart
An aggregation chart groups together a collection of data by a value of choice. The aggregation chart can be sorted by clicking any of the displayed column headers. If you wish to see the detailed list of all objects making up one of the groups, click the “Explore” button to open the Browse view. To browse all the objects in all groups, click “Explore all”.
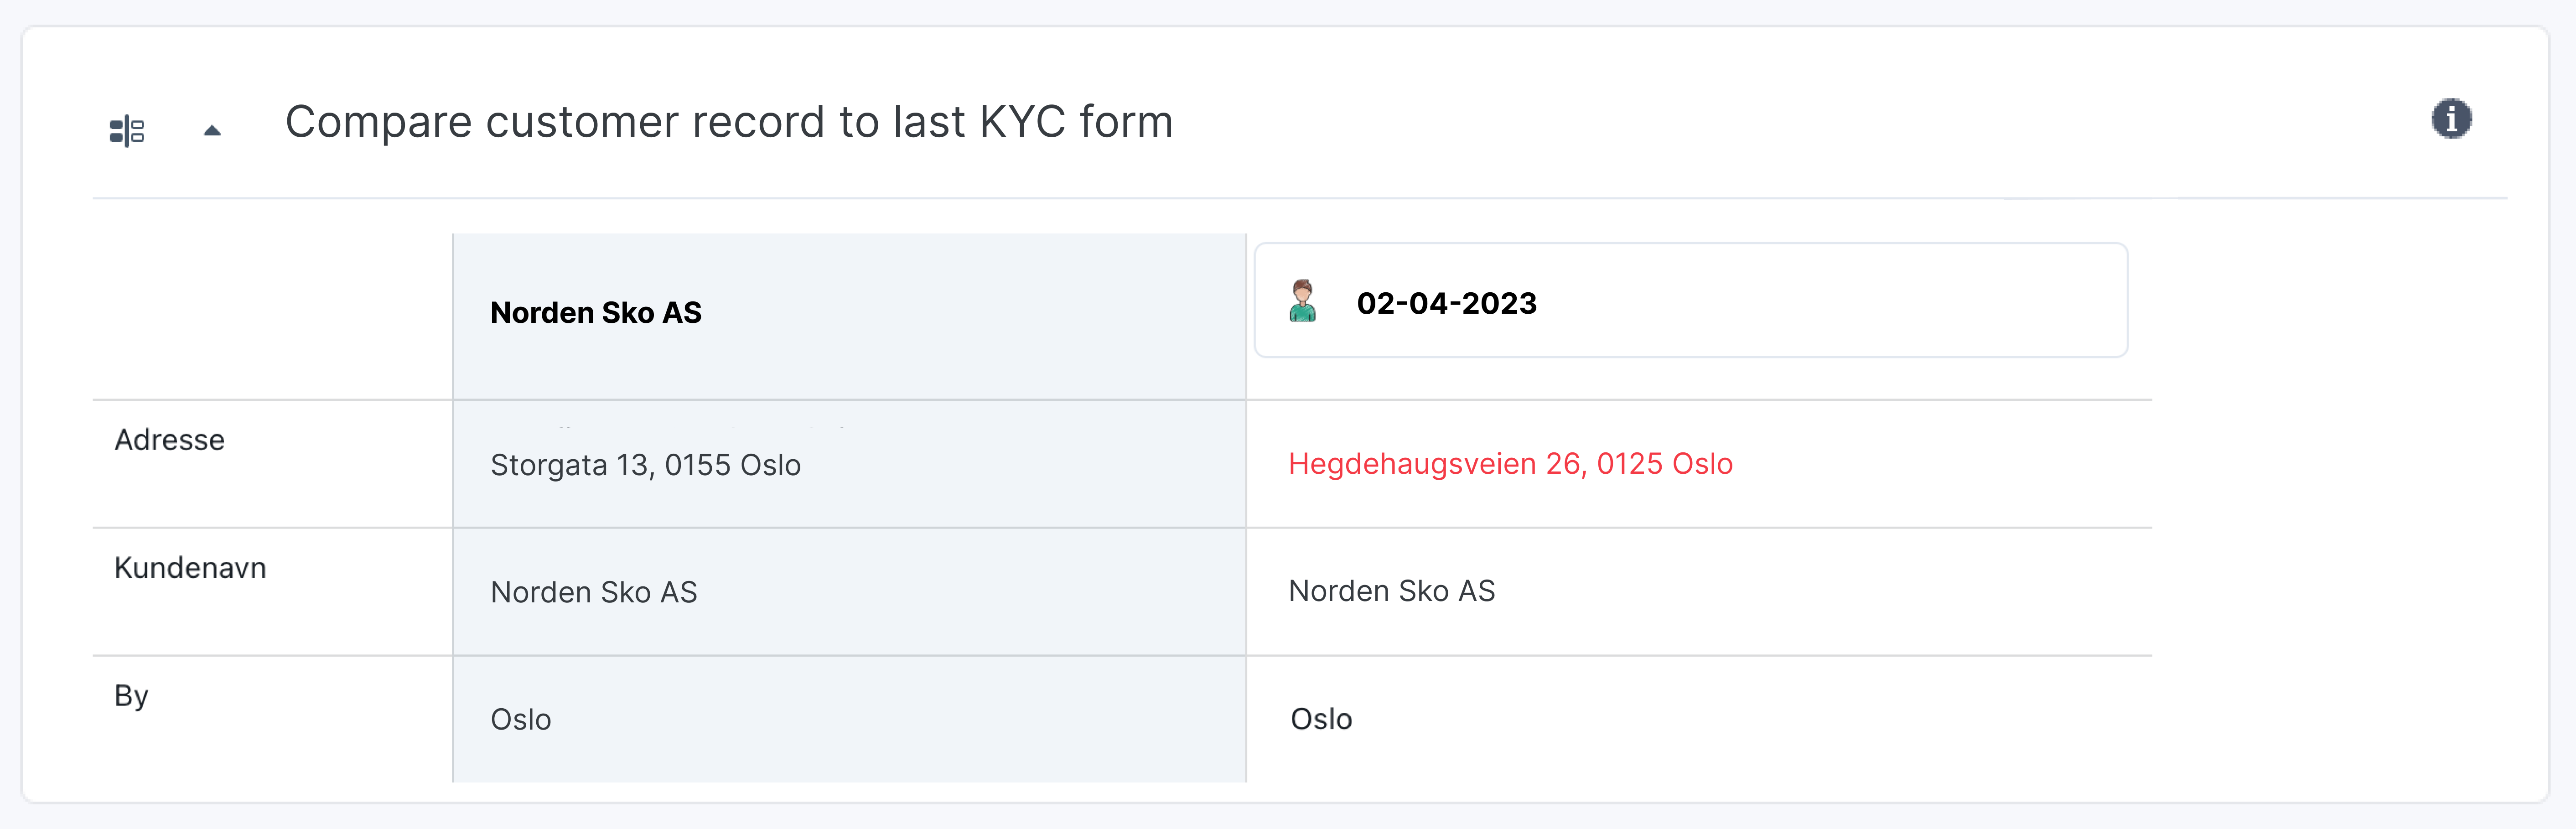
Comparison chart
The comparison chart compares how the same data points have changed over time, where each column represents a point in time (e.g. a response date for a submitted form). The “+” and “-“ buttons can be clicked to add or remove columns to the view, so that the user can choose how much history they want to display. Data points that have changed since the previous column will be highlighted in yellow. This highlighting can be turned on or off with the “Show changes” toggle.
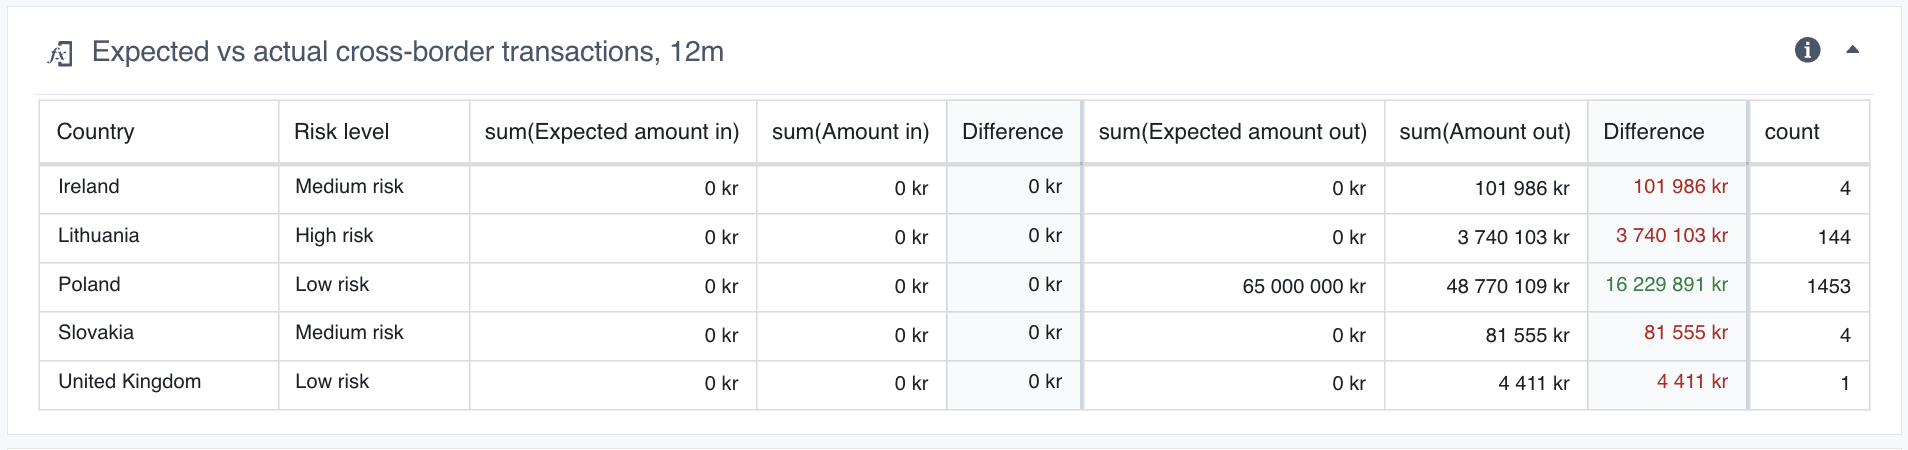
Aggregation comparison chart
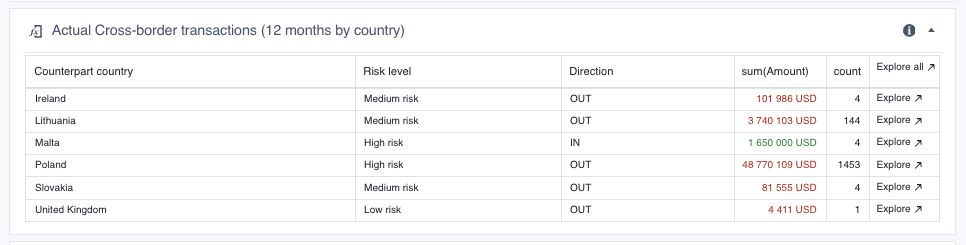
The aggregation comparsion chart is used to compare aggregated values from different data sources. An example is shown below, where the chart compares the sum of a customer’s expected transactions to/from a country with the sum of the customer’s actual transactions to/from a country. The “Difference” column shows the difference between the values in the previous two columns. In the example below, a green number means that the actual amount is lower than the expected amount, and a red number means that the actual amount is higher than the expected amount. E.g: a red number in the “Difference” column indicates that the sum of actual transactions with a specific country is outside the bounds of the expected amount.
To see the detailed list of objects making up any of the sums (e.g. the list of all singular, actual transactions to a specific country), hover the mouse over the sum in question and click the arrow-button that appears. The selected set of objects will then open in Browse view.
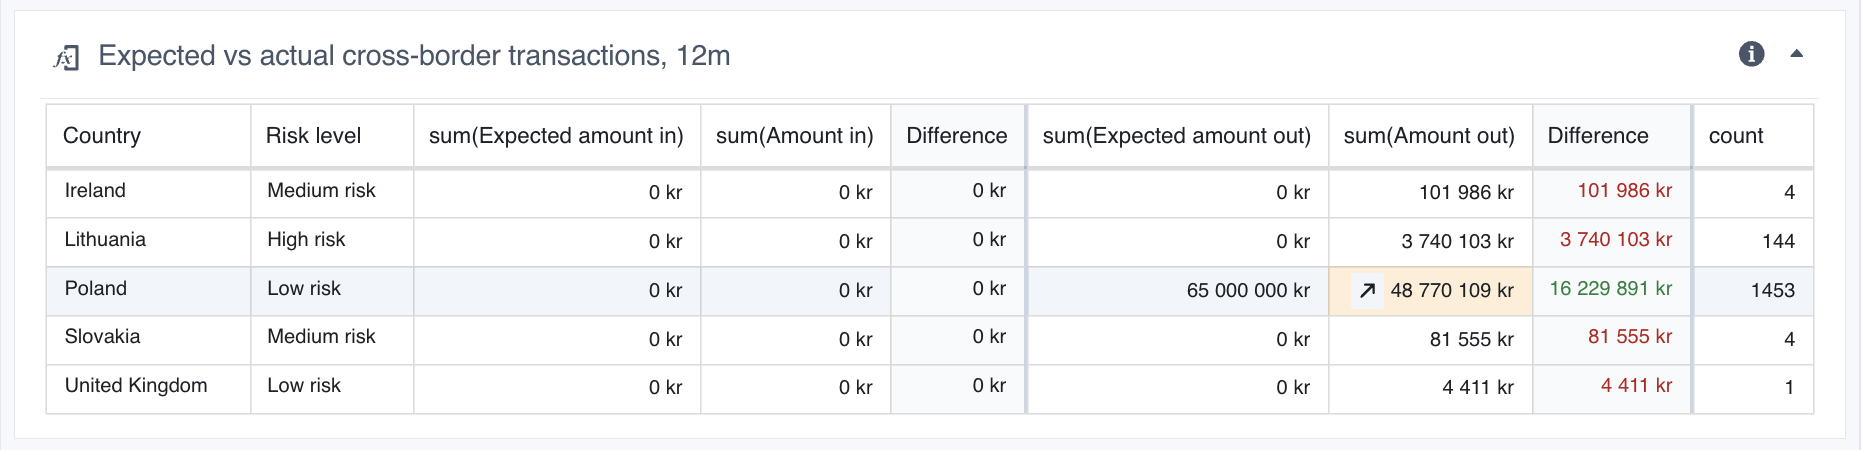 Click the arrow-button inside the highlighted cell to open a Browse view of all actual transactions out to Poland
A risk indicator is a type of flag that alerts about detected risk on a specific object. The risk indicator will be in triggered or not triggered state based on the result of checks done on the data related to the object. An example of an indicator could be to detect whether a customer has made transactions to a high-risk foreign country.
A risk indicator consists of a status icon, accompanied by a descriptive text explaining the detected risk. The status icon can be in one of three possible states:
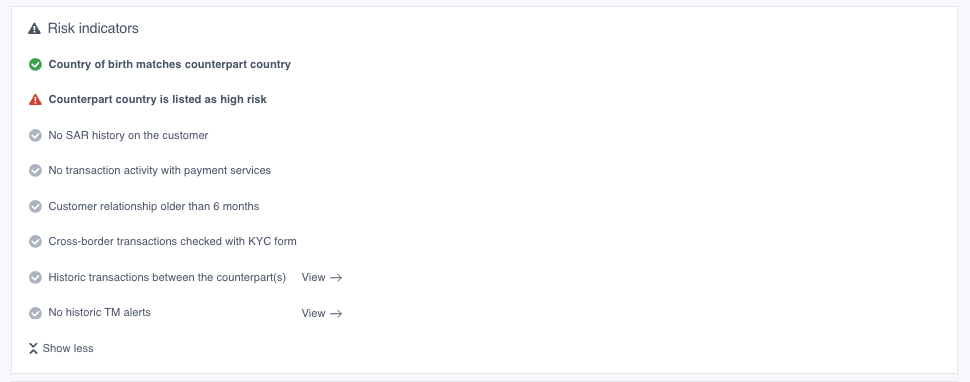 Examples of Risk Indicators on a transaction monitoring alert object
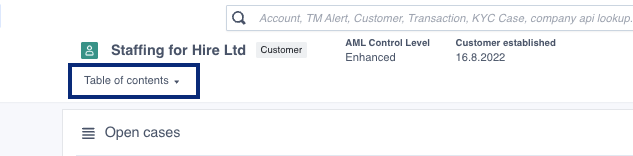
The Table of Contents contains an overview over all subpages and charts belonging to an overview. It can be found by clicking the button in the object view header or at the bottom of the object view front page.
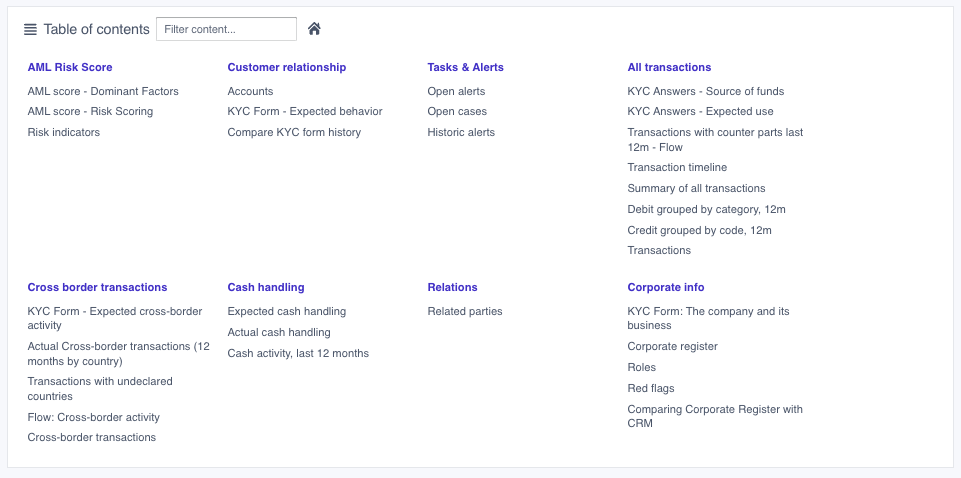
The purple headers int the table represent the subpages, click these to navigate to said subpage. The grey headers represent the charts displayed in each subpage, click these to navigate to that specific chart only. The Table of Contents contains a search bar which allows you to filter the contents of the table.
An object view can include several subpages, each containing charts that display information about some topic. The subpages is a way to group and organize information that relates to the object you are viewing. You can see the overview over all subpages belonging to an object view in the Table of Contents.
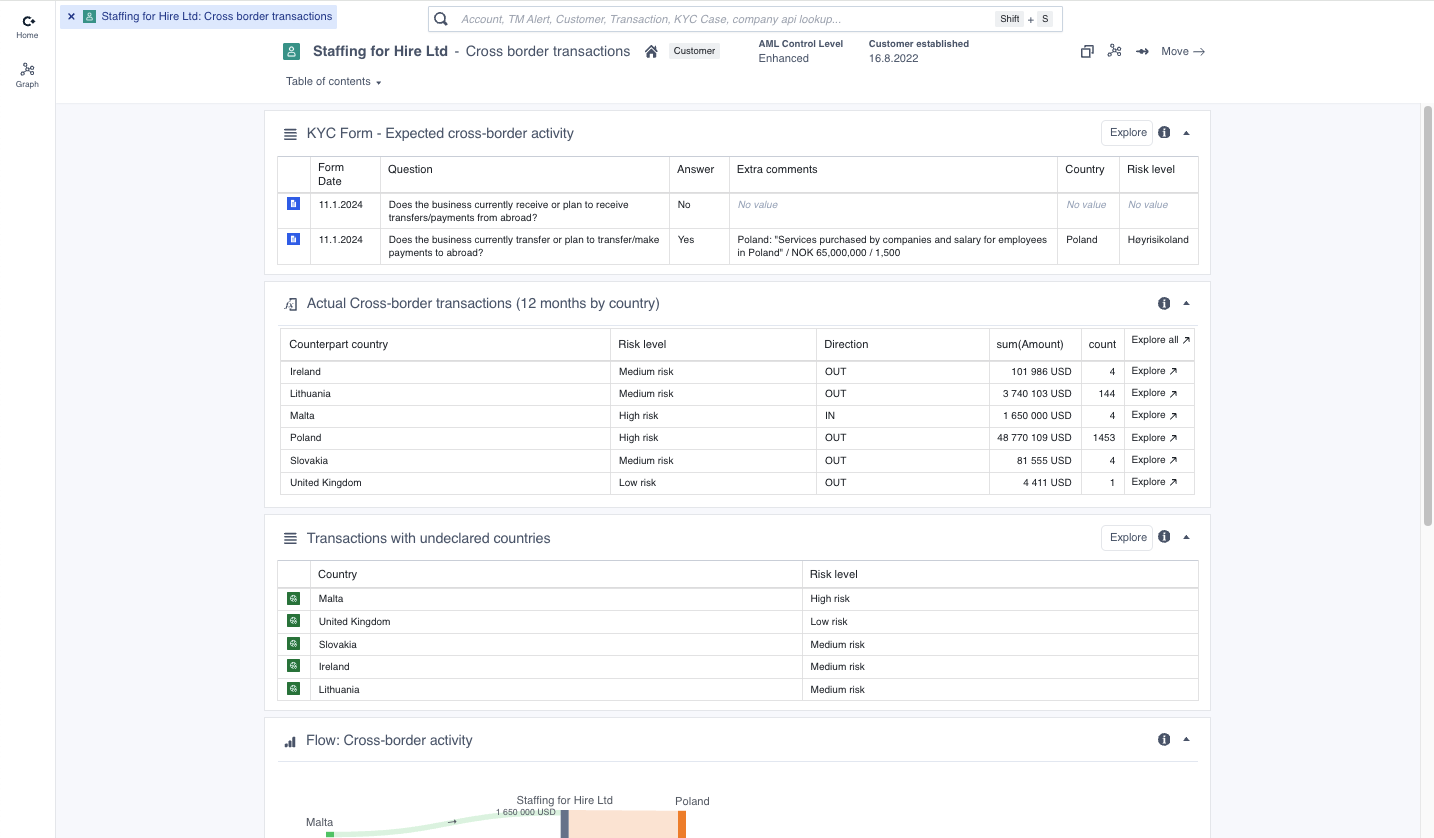 A subpage containing information about cross-border transactions for some customer. Note that the object view header includes information about which sub page that is being viewed.
A special type of data view is the report view, which allows a user to work through a defined analysis workflow and document their findings. Read more about reporting in the Reporting section
File: Getting started
Convier uses the SSO (single sign-on) solution of your organization. Use your regular company credentials when signing in to Convier for the first time. When opening the application again, you will be remembered and automatically logged in.
The object view is the entry point to all the information that Convier has access to on some entity (f.ex. a Customer). This page can be used to get an overview of the available information, or as a starting point to dive deeper into the detailed data connected to this entity. Read more about object views here.
To open the object a specific object view, either use the search function, or use a direct link URL from some internal system integrated with Convier (f.ex. from a task in a CRM system).
An object view for a Customer object
The report view is a tool that helps analysts work through a specified analysis workflow and document their findings while they work. The reporting functionality aims to both streamline the data analysis, as well as automate as much as possible of the manual documentation work. Read more about reporting in Convier here.
A report view is connected to an object view in Convier, usually one representing a task or alert. Open a specific report either by searching for the corresponding task or alert, or by using a direct link URL from some internal system integrated with Convier (f.ex. from a task in a CRM system).
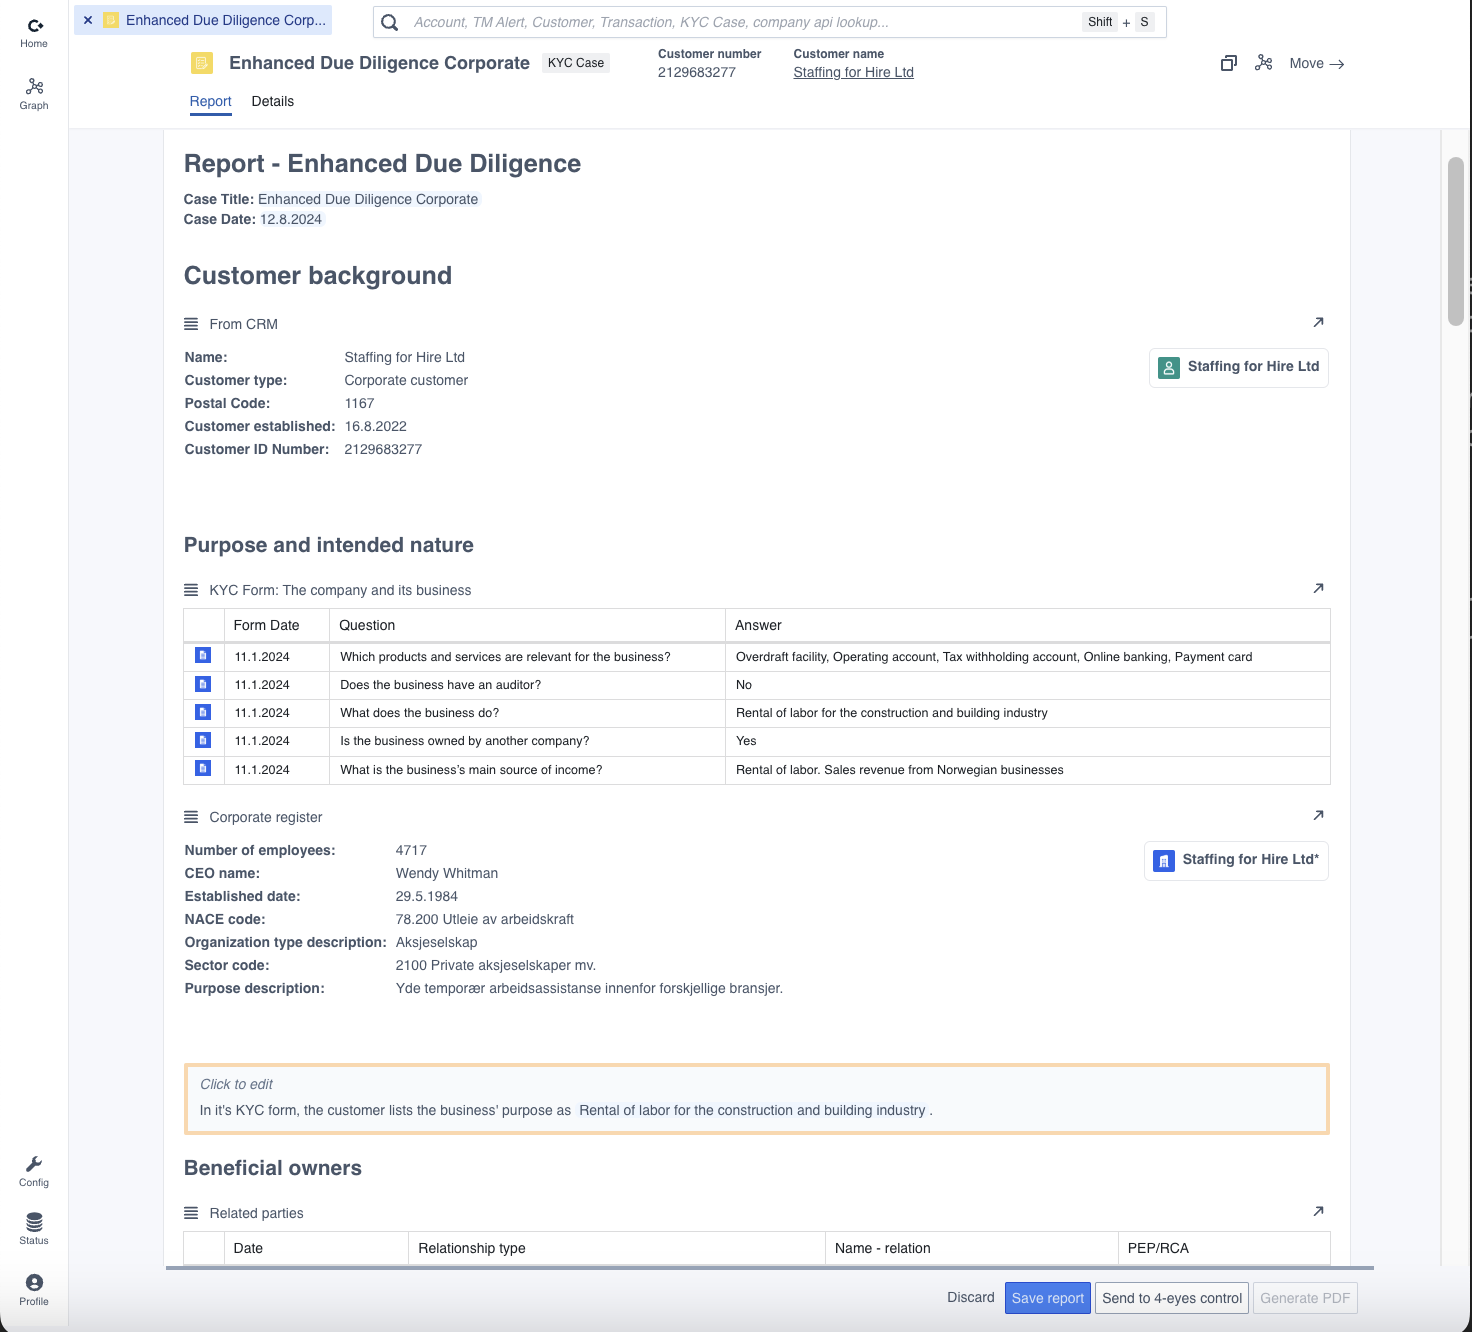 Example of a report view for an Enhanced Due Diligence report, connected to a KYC Case object
Read more about how to navigate in the platform here.
Convier offers a variety of functionality and tools for diving deeper into the data analysis. Details and relations in data such as transactions and customer data can be explored using aggregation tables, transaction flow charts or the graph application. The Analysing data section contains more information on how to perform in-depth data analysis in Convier.
File: Navigation
Convier has functionality for exploring and analysing data in different ways, depending on the usecase.
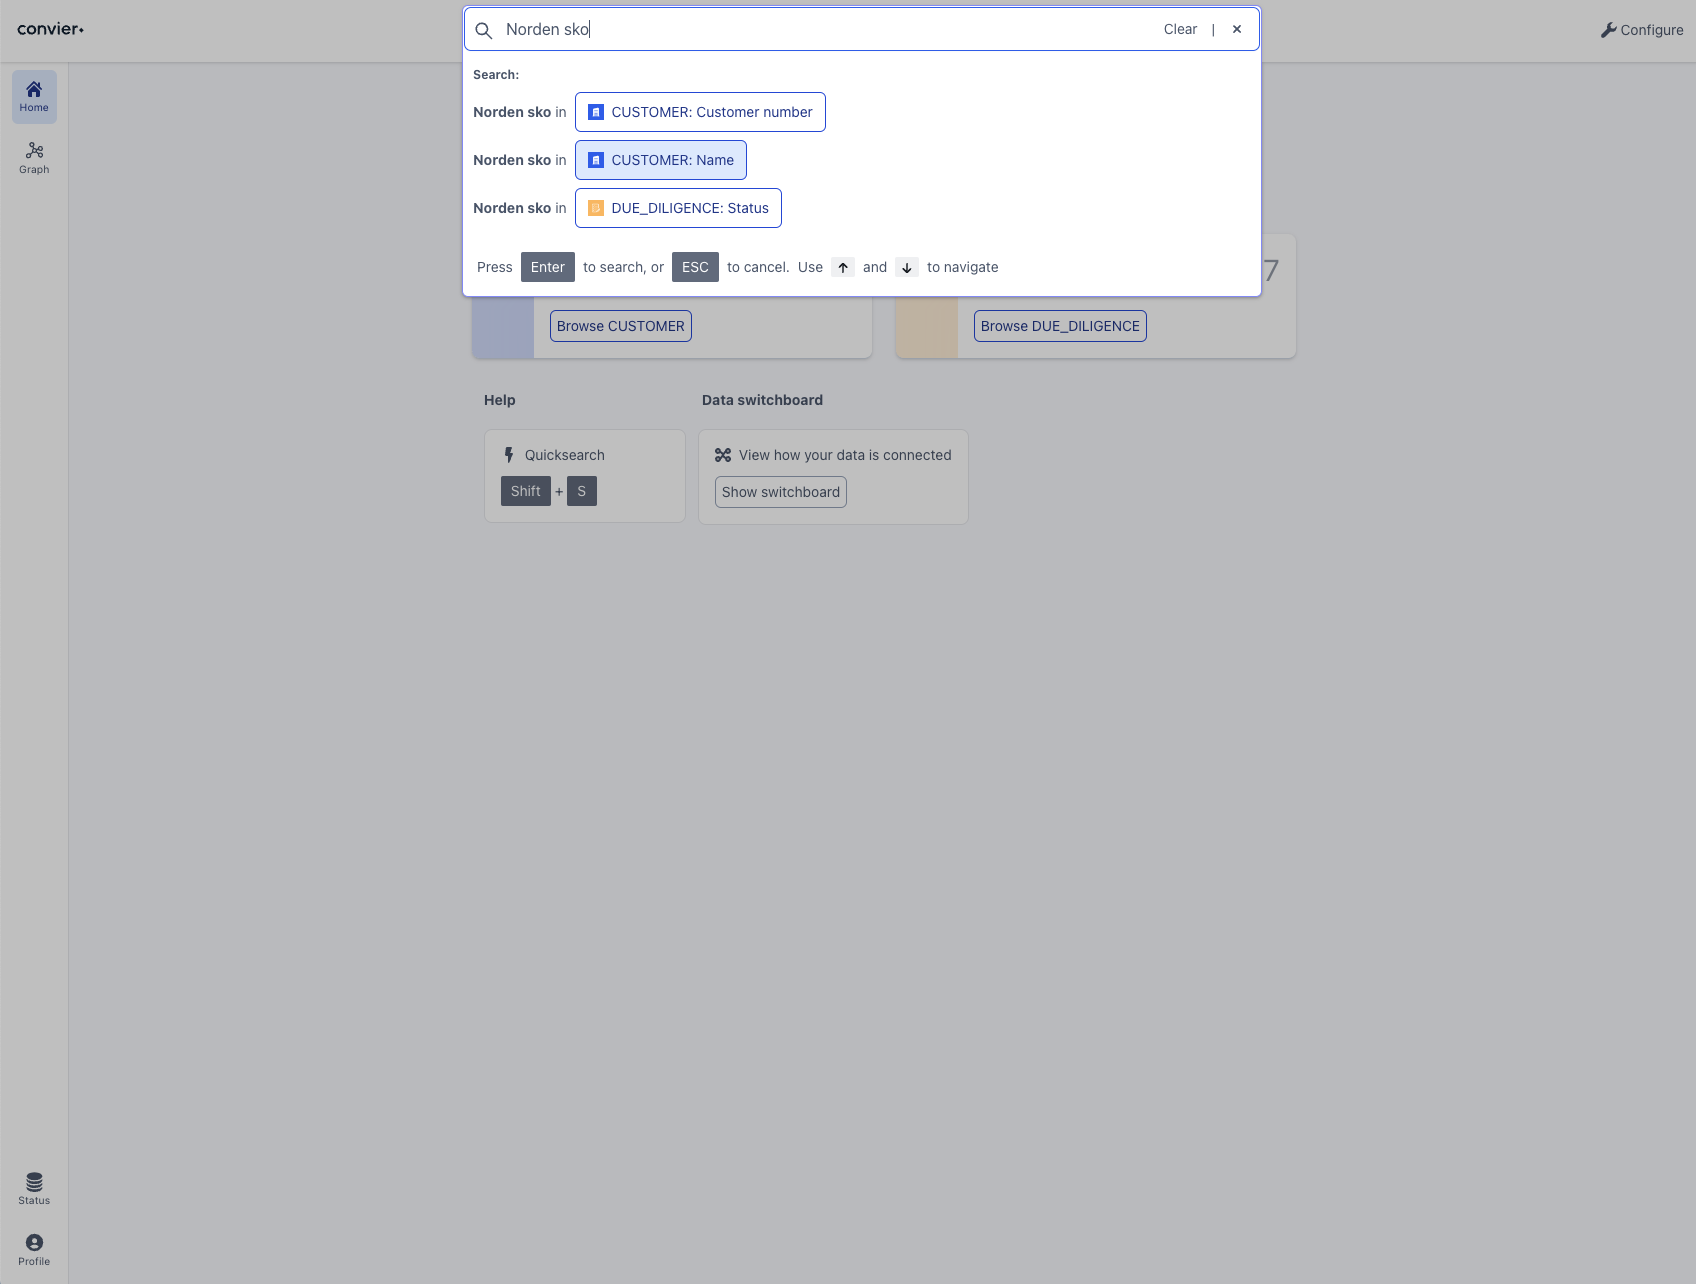
To see and explore all the data related to some entity (e.g. a customer), you can search for that object to open the corresponding object view. The search bar is always found at the top of the page. Clicking the search bar will reveal which information is searchable in the platform. Typically it is possible to search for a Customer, an Account, a Task etc. When you start typing in the search bar, additional hints will show up to help show which data values you can use to search for each object type. In the example below, a Customer can for example be searched by Name or Customer ID Number. Select the object type and value you are searching with to make the search quicker. Hit Enter to search.
A lot of the components in the Conviers views are clickable, and will take you to the object view of the element you are clicking. Some examples of clickable elements that will open an object view:
If you have Convier open on a wide screen, the new object view will by default open in the right side panel. Use “Move” to change the display location.
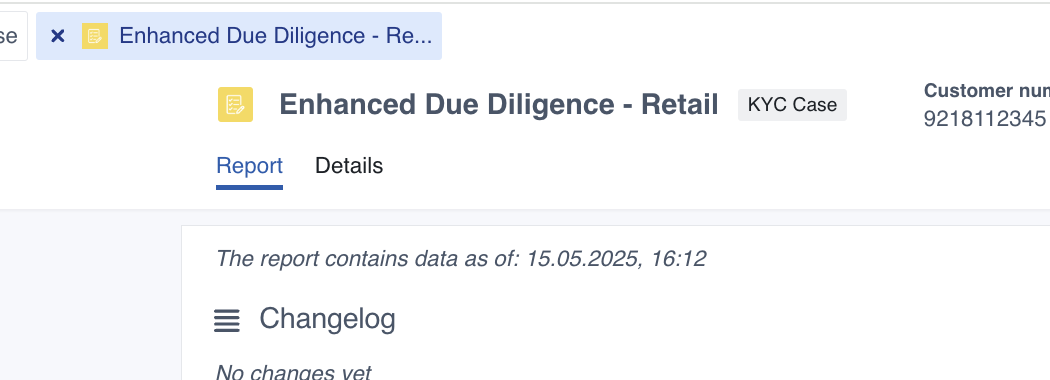
Navigation between views in Convier behaves very similarly to navigation in a web browser. A view is always opened in a tab, and all open tabs can be seen in the top header. You can switch between tabs by clicking on them, or close a tab by clicking the “x” on the left side of that tab.
 A row of 3 open tabs. Tabs can be closed by clicking the ‘x’-button.
It is possible to see 2 views side-by-side in Convier, by opening one view in the right-hand side panel. When using Convier on a wide screen, new views will be opened in the right-hand side panel by default. Drag the middle split bar to resize the side panel width. Tabs can be moved from the left to the right side of the screen (or back) by using the “Move”-buttons in the top right corner or a view.
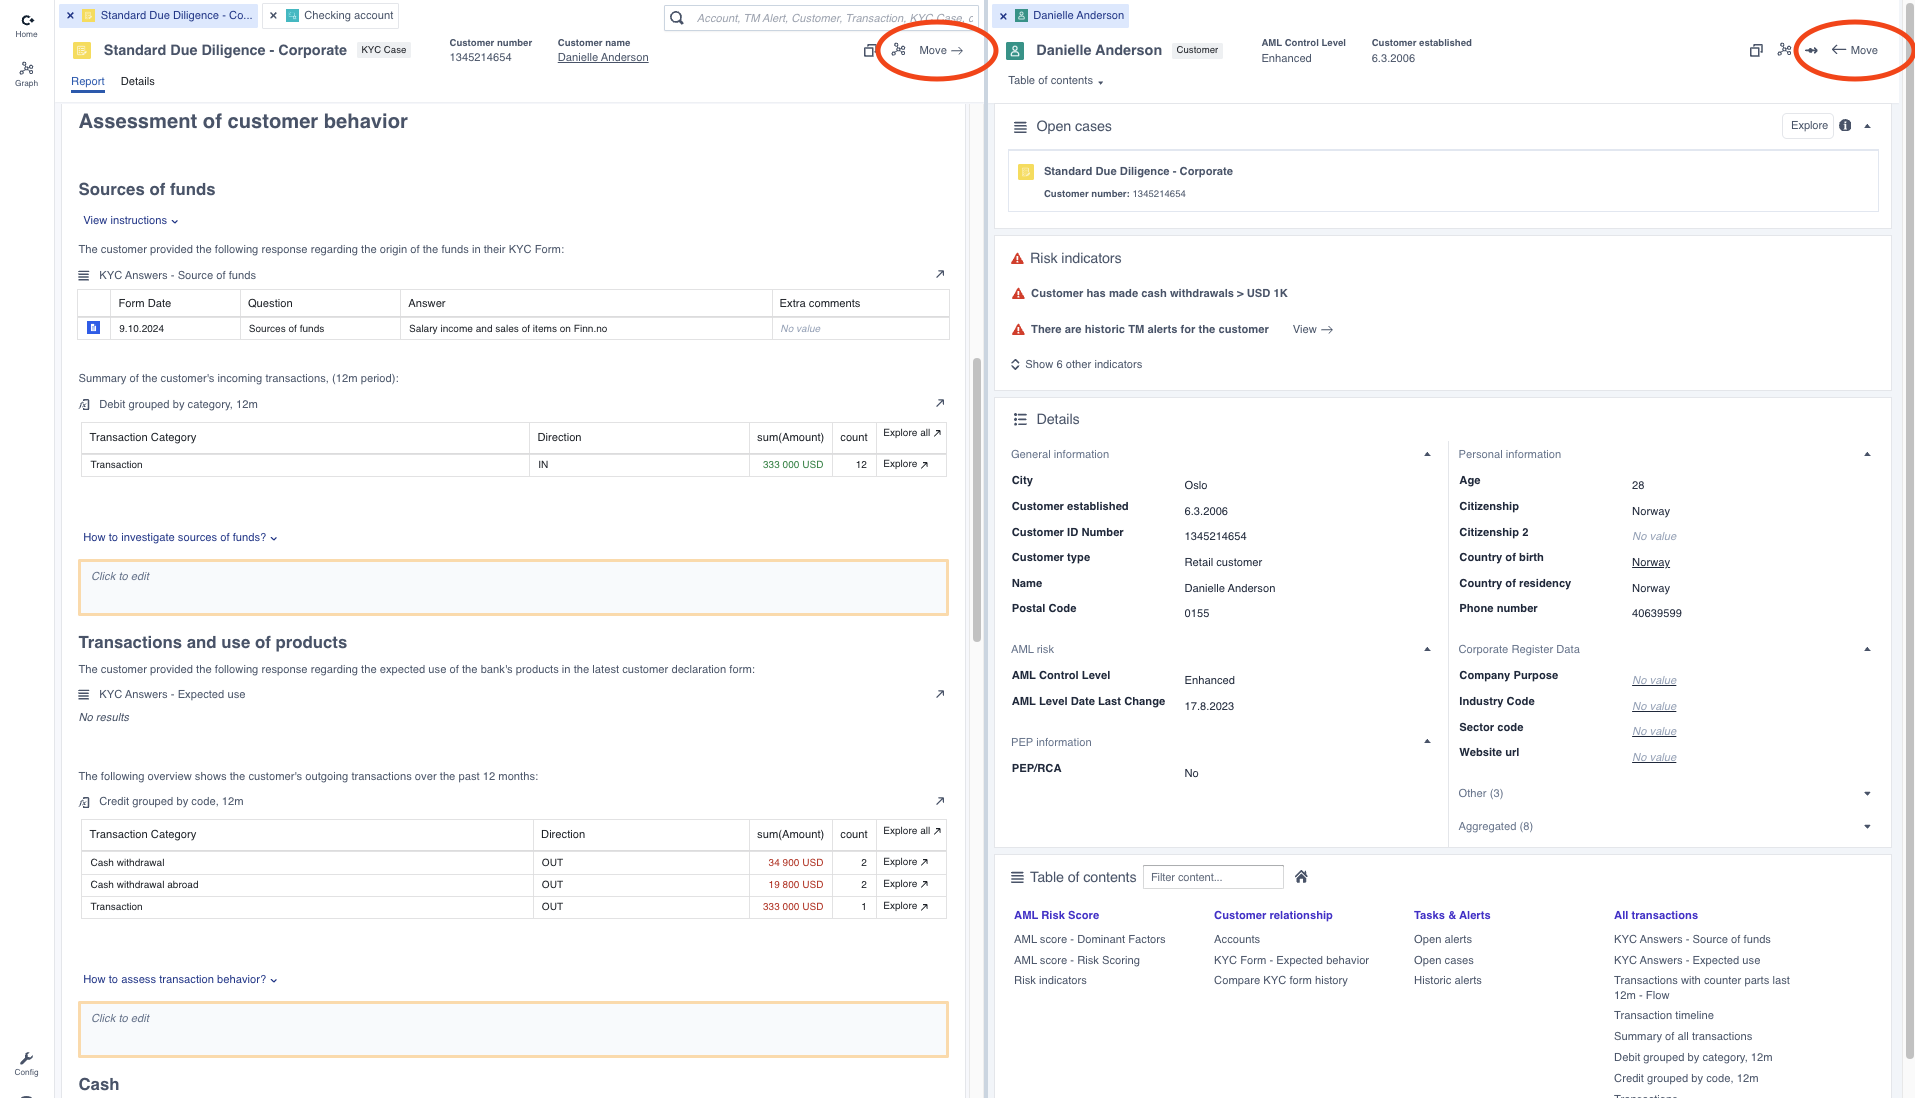 A side-by-side view of a report view and a customer view. The “Move” buttons (circeled) can be used to move a tab between left and right side panels (or fullscreen view)
A Convier installation will usually be integrated with some other system which contains direct hyperlinks into an object or report view in Convier. An example is a CRM system containing links from a specific task in a CRM task list to the corresponding task view in Convier. This setup is commonly used to make it easy for analysts to move from their task list or dashboard in CRM and directly into the corresponding report view for that workflow.
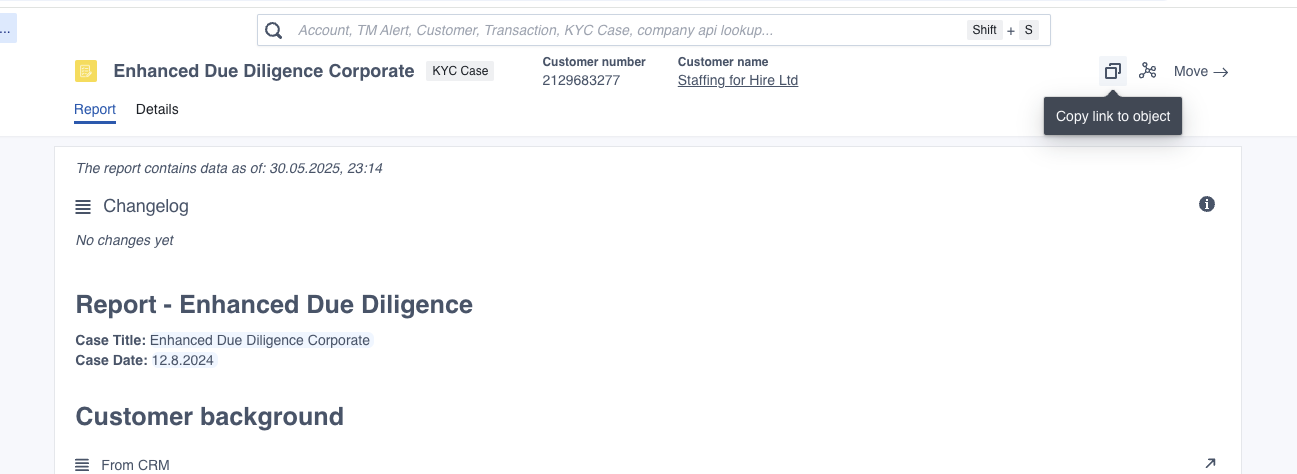
The direct URL to a specific object view can be copied by clicking the “copy”-button in the object view header.
File: Reporting
One of the main usecases in Convier is going through a reporting workflow. This section will describe how to review and write a report in Convier, how to deep-dive into data analysis during the report workflow, how reports are stored and how Convier can automate certain workflow tasks in connection with other systems.
The report view can be added to an object view, usually on an object representing some sort of task or alert. The purpose of the report is to make it as easy as possible for a user to analyse and document every necessary step in a defined analysis workflow. Examples of such workflows are Customer Due Diligence reviews or reviewing a Transaction Monitoring alert.
Example of a report view for an Enhanced Due Diligence report, connected to a KYC Case object
If an object has a report view configured, this will be the first thing that is displayed when opening this object. To switch between the normal object view and the report view, click the “Report” or “Details” tabs in the header banner.
The report view consists of sections addressing different themes or steps in the designed workflow. Each section can contain
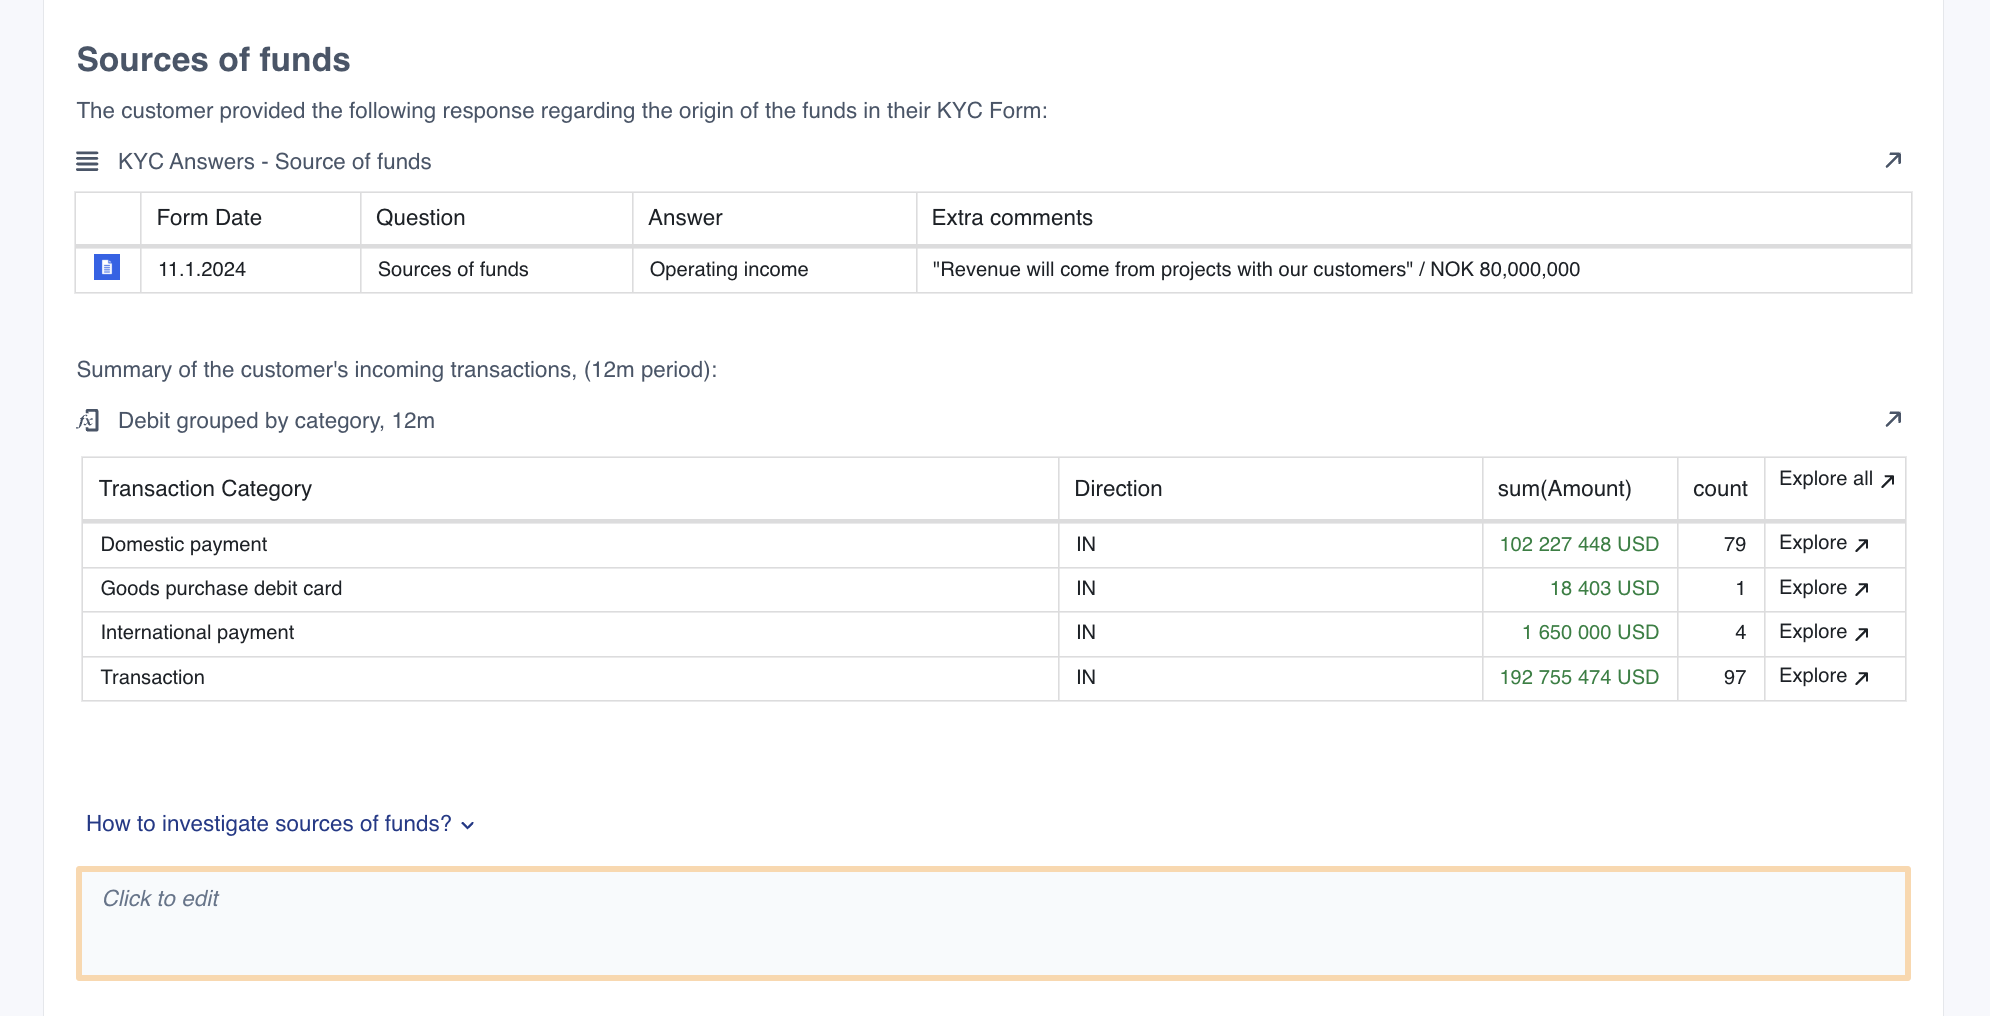 Example of a report section dedicated to documenting a customer’s sources of funds
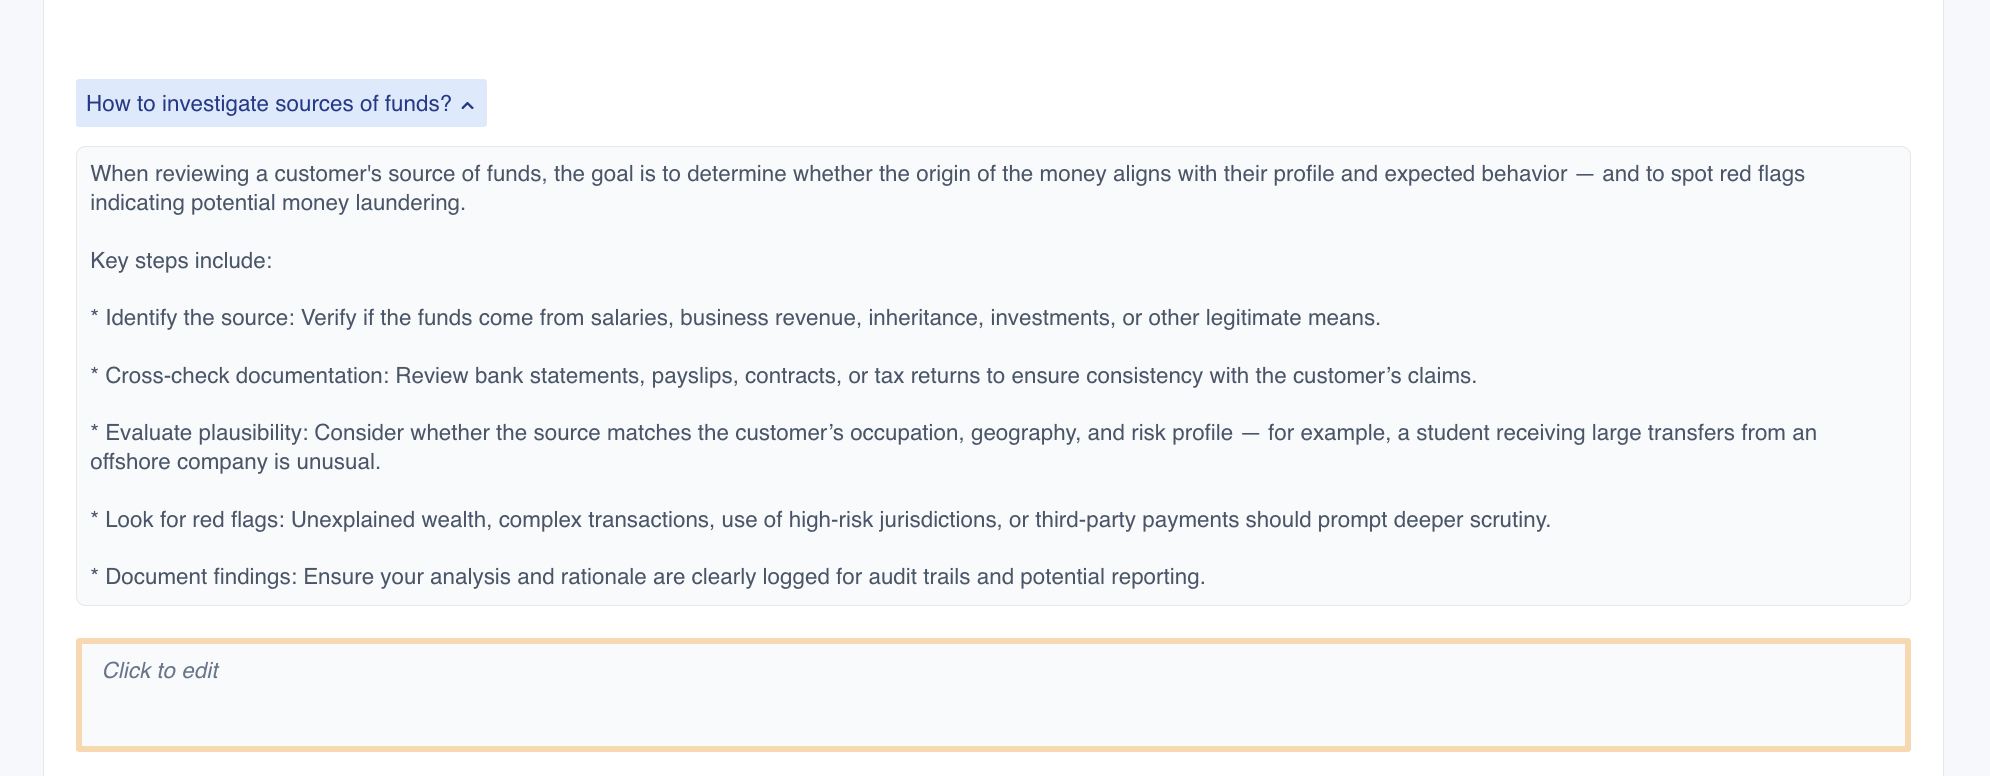 Click the helptext dropdown to see guidelines related to this report section
Some of the charts in the report will contain a date selector that allows changing the date range for the data loaded in the report. Usually, the report is configured such that the time range selected for one chart will be applied to all transaction data in the report.
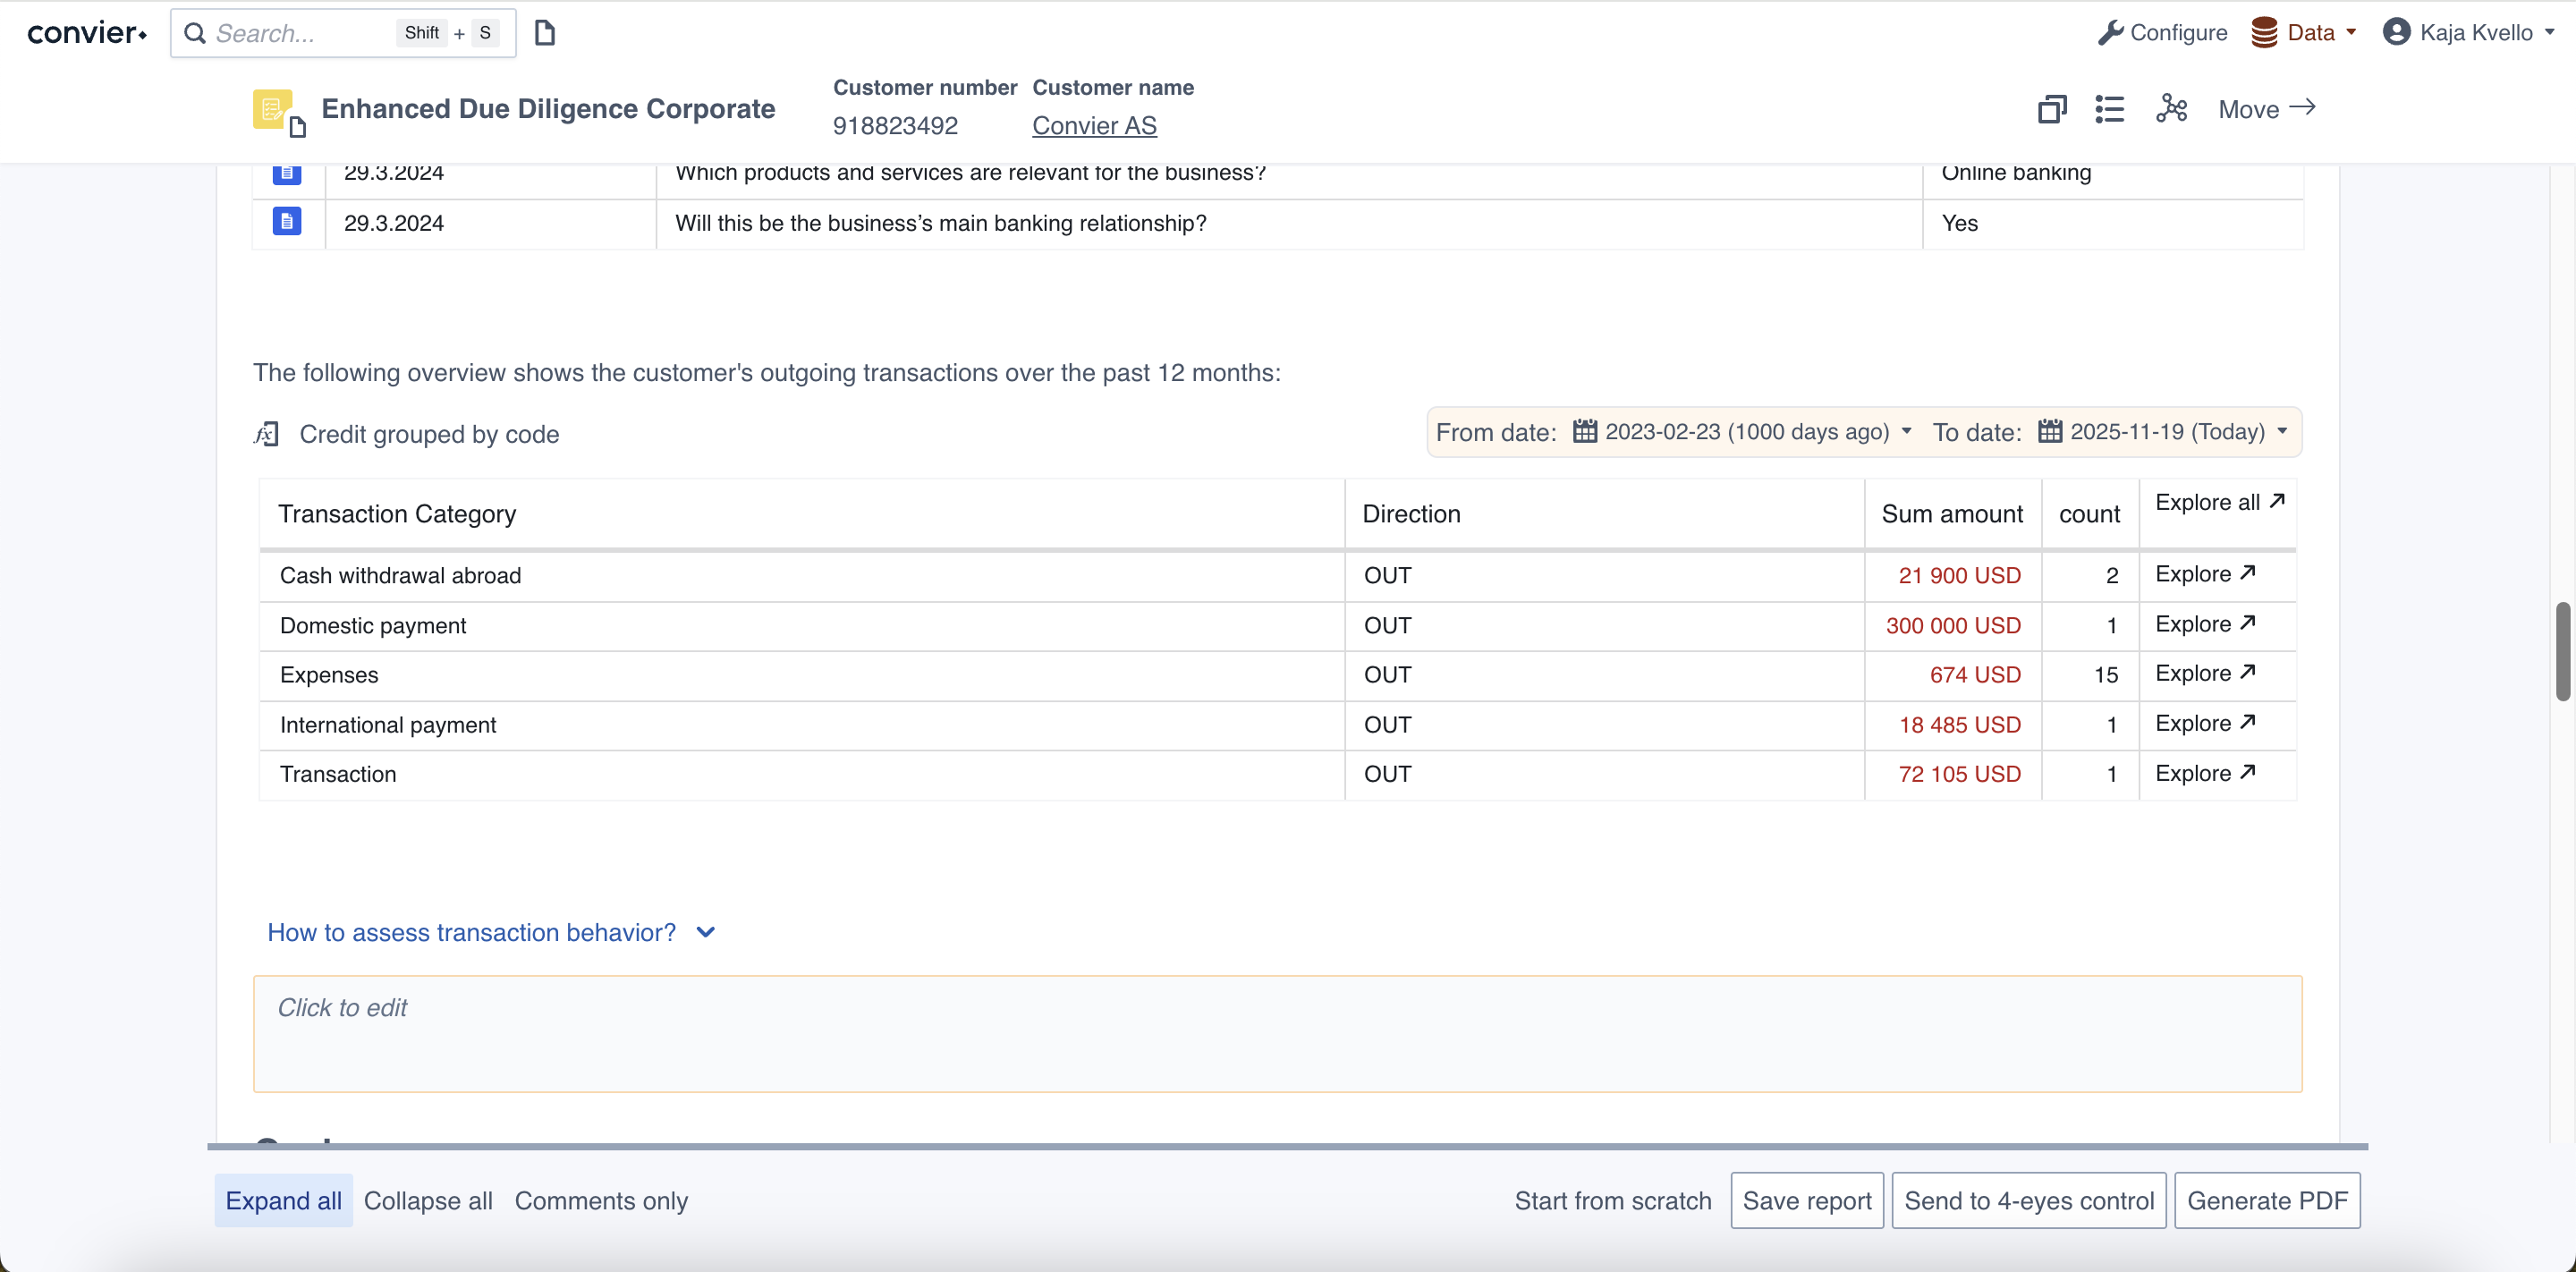 A report section containing a chart with date selector
The report view attempts to give an overview of the data that is relevant for the analysis task at hand. However, it is sometimes necessary to dive into detailed data. All charts in the report view are clickable, and can take you to a more detailed view of the data it is displaying. For instructions of how to navigate into detailed data views from each chart type, see the chart descriptions. If your screen is wide enough, all views opened from the reporting view will by default end up in the right-hand side panel. The new tab can be moved or closed as described in the navigation section.
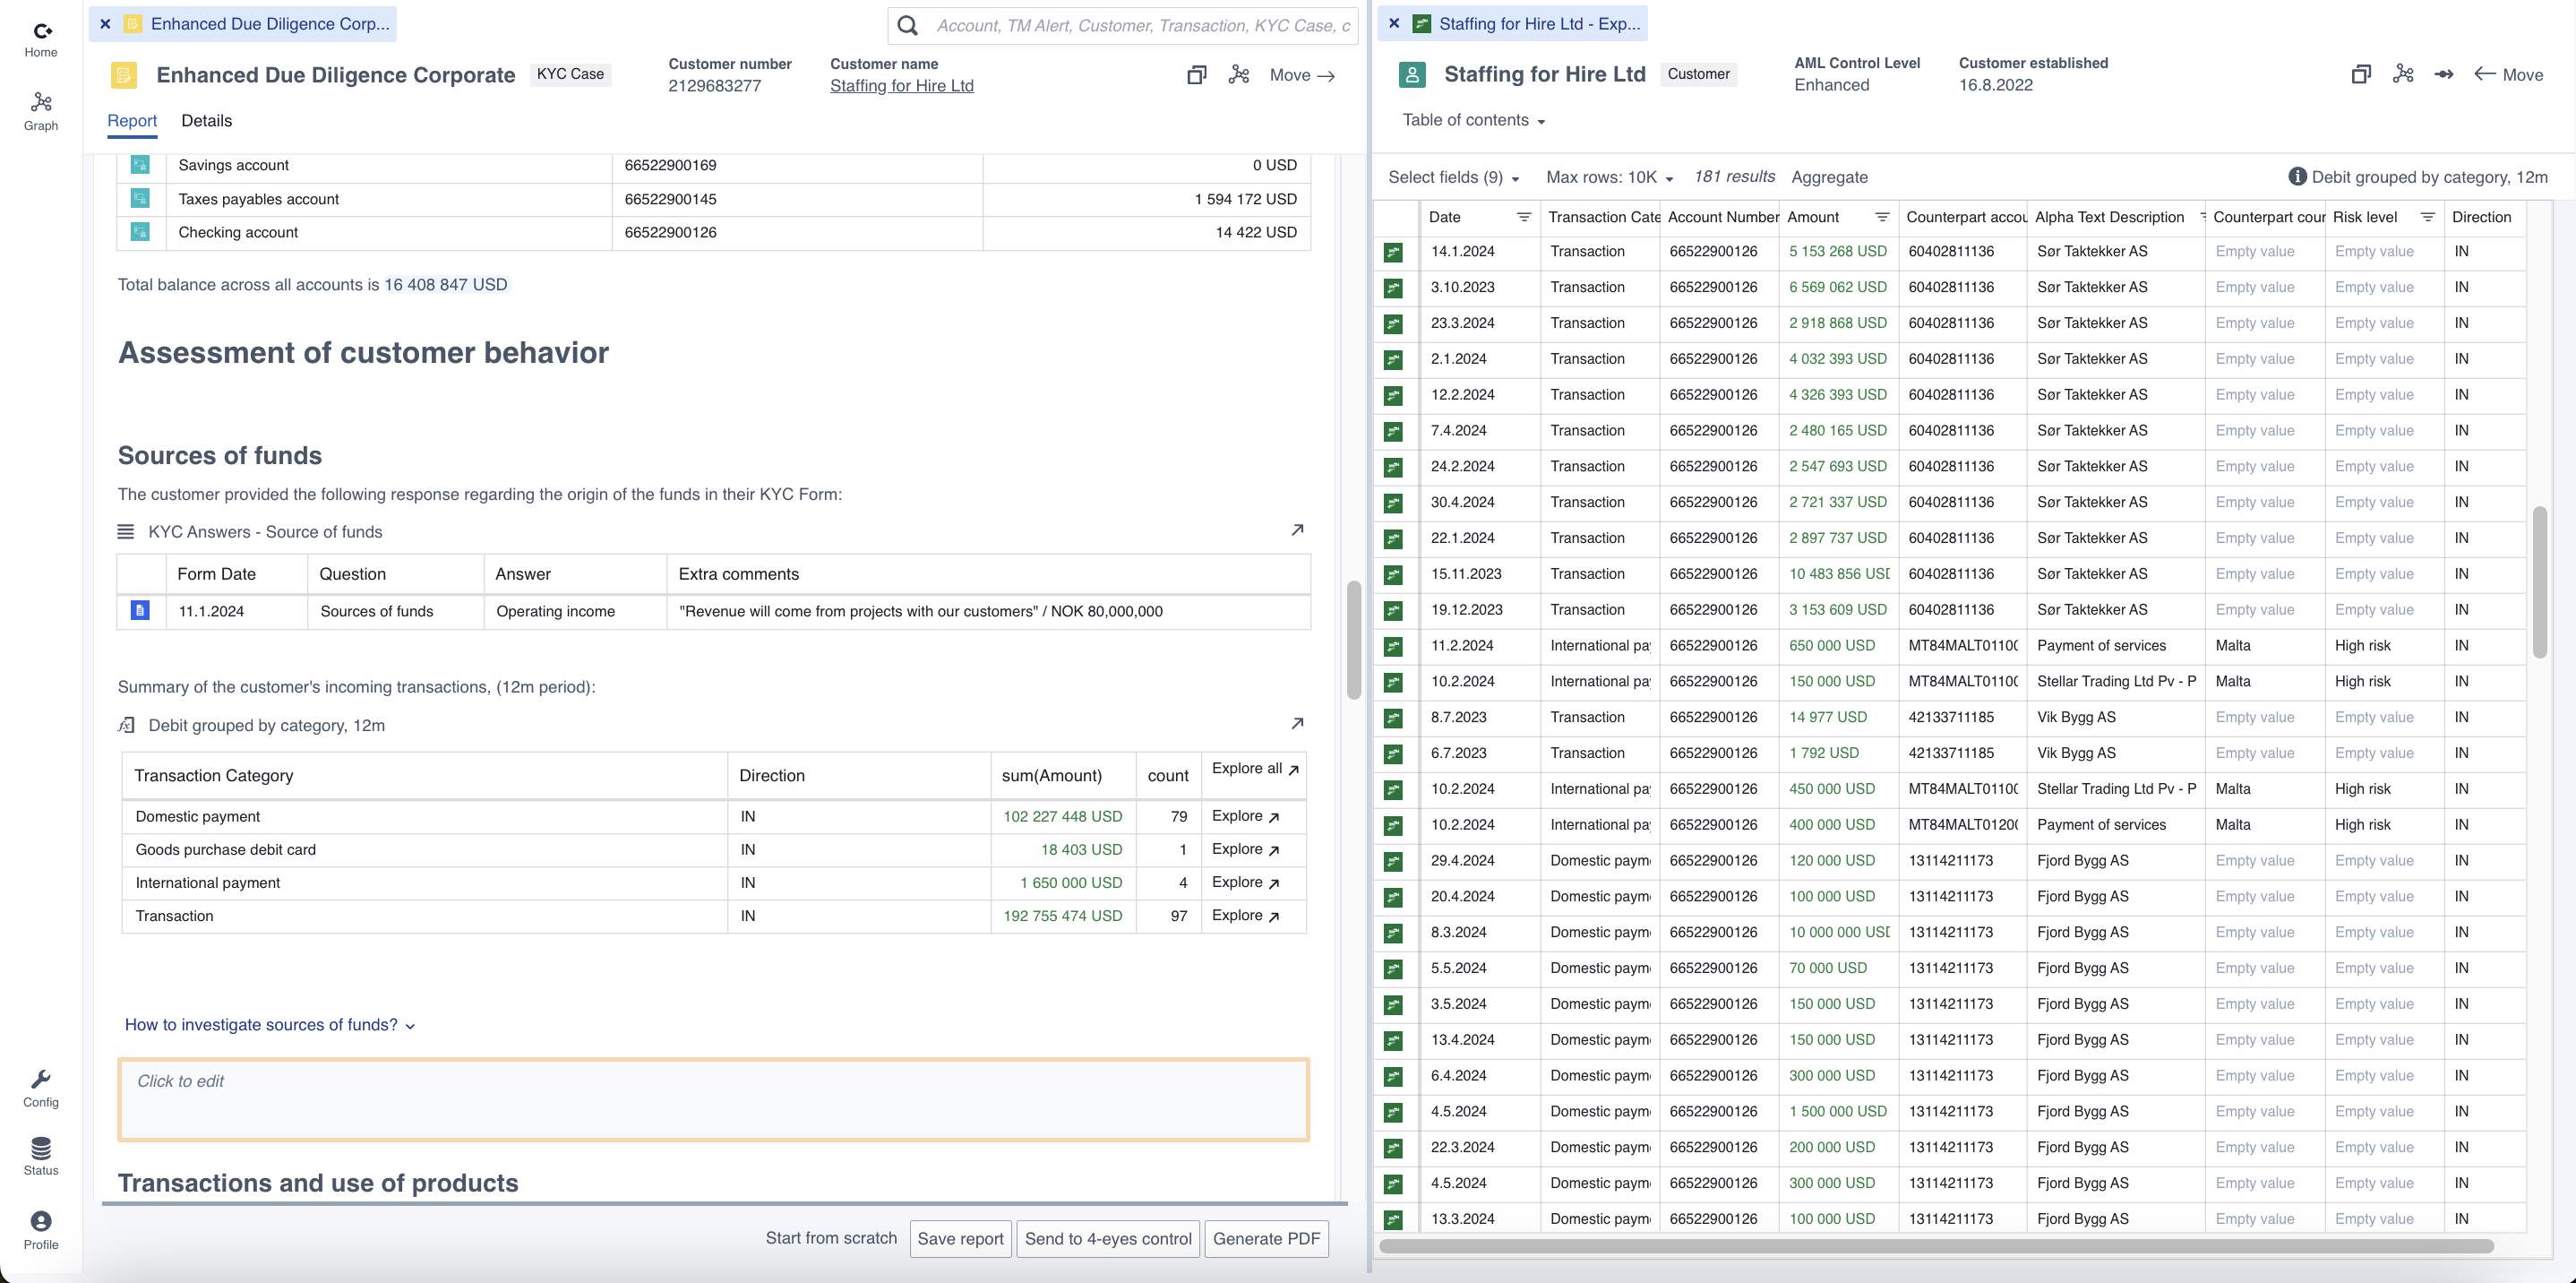 Side-by-side view of a report and a Browse view produced by clicking “Explore all” from the “Debit grouped by category”-chart in the report
The report view will usually contain multiple user input fields which the analyst can use to document their findings during the analysis.
Free text input
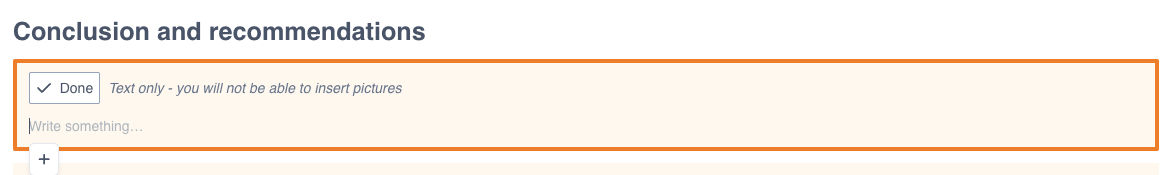
The freetext field allows you to write any text, paste in images or screenshots or add data directly from charts.
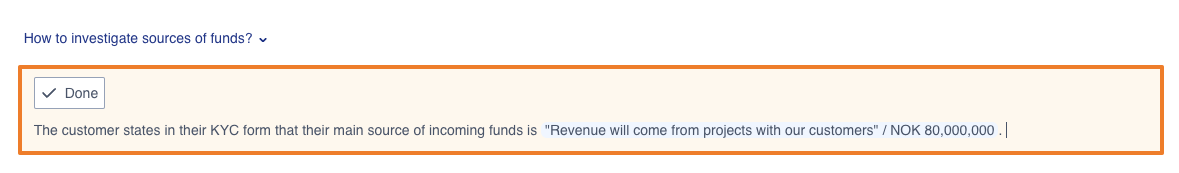
Some free text fields are configured to only accept text input, and will therefore block pasting of any images into the input field. Such input fields will display an info message when chosed as the active field.
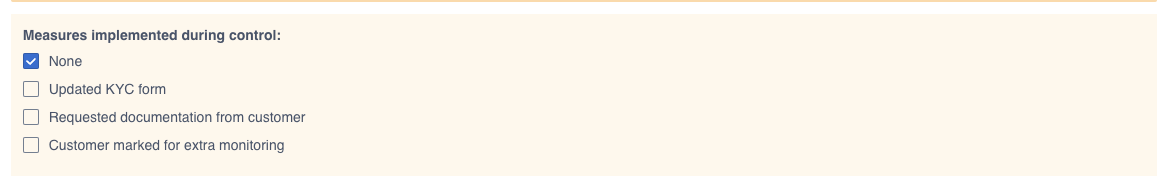
Multiselect
A multiselect input field allows the user to select bewteen several predefined choices.
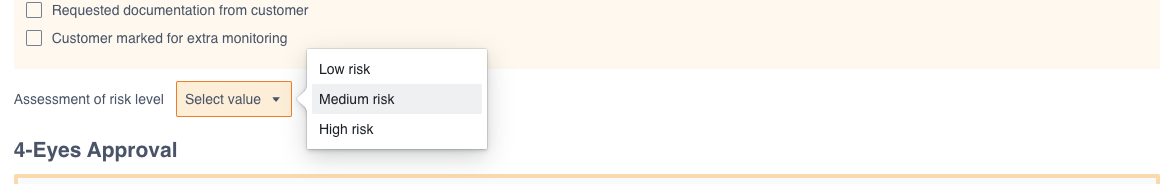
Dropdown select
The dropdown input field allows the user to select one out of several predefined choices.
Data from the charts and views in the platform can be added into the input fields of a report using the “Add to report”-functionality. In order to add a value into an input field, first select the input field you want to add the data into. When an input field is selected as active, an “Add to report” tooltip will start appearing when hovering the mouse over data fields in the report or charts in the platform.
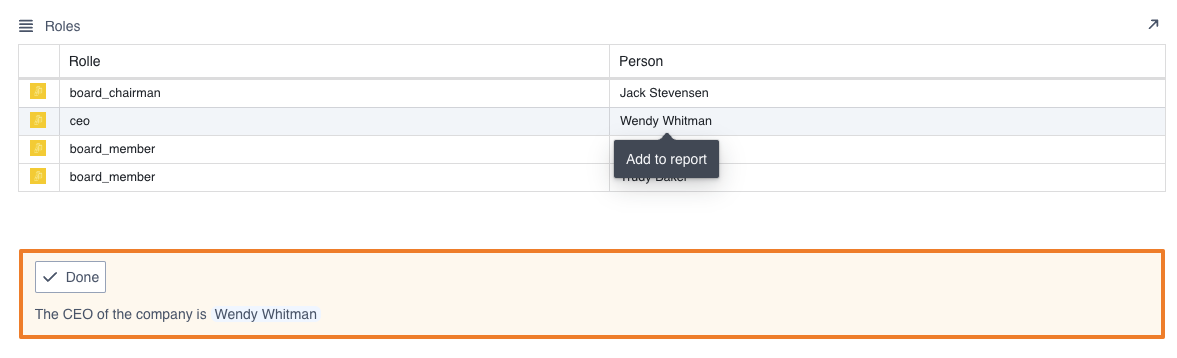 A value has been added to the input field using the “Add to report” functionality
Entire rows of data can also be brought into the input fields from the Browse view. Again, start by selecting the input field you want to add the data into. Then, mark the rows you wish to add to the report. Hold down Cmd or Ctrl to select several rows. A button marked “Add selected to report” will appear at the top of the Browse view, which can be clicked to add the selectd rows into the report.
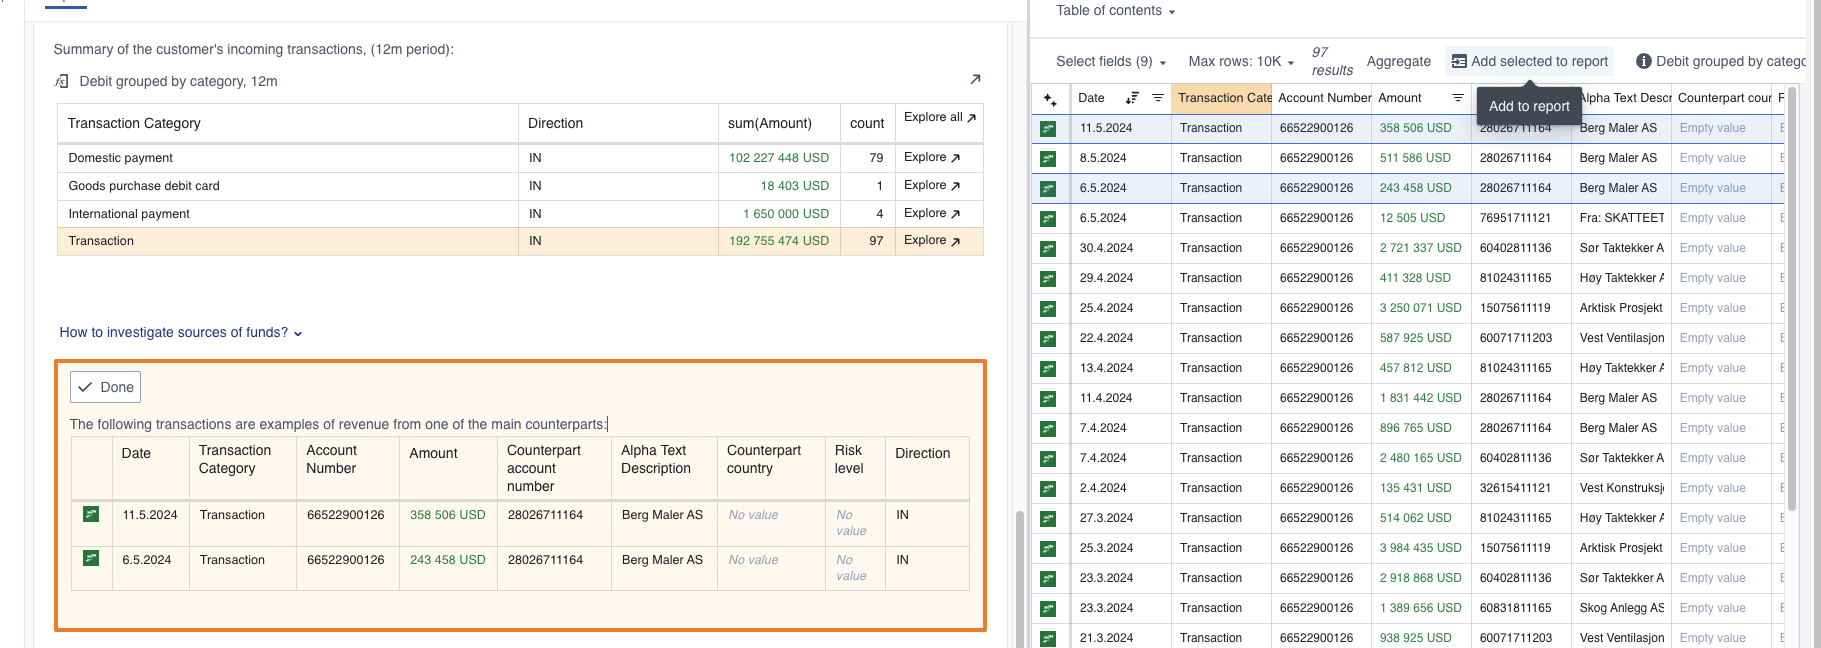 Two rows of transaction data has been added to the input field from the “Browse” view
it is possible to make reports show in read-only mode when they are deemed finished, e.g. when the connected CRM-task is set as “closed”. All input-fields in the report will be locked and impossible to edit in read-only mode. To “re-open” the report and continue editing it, the trigger value for the read-only mode must be changed. This can usually be achieved by reopening the connected case in the CRM-system (depending on the Convier setup in your organisation).
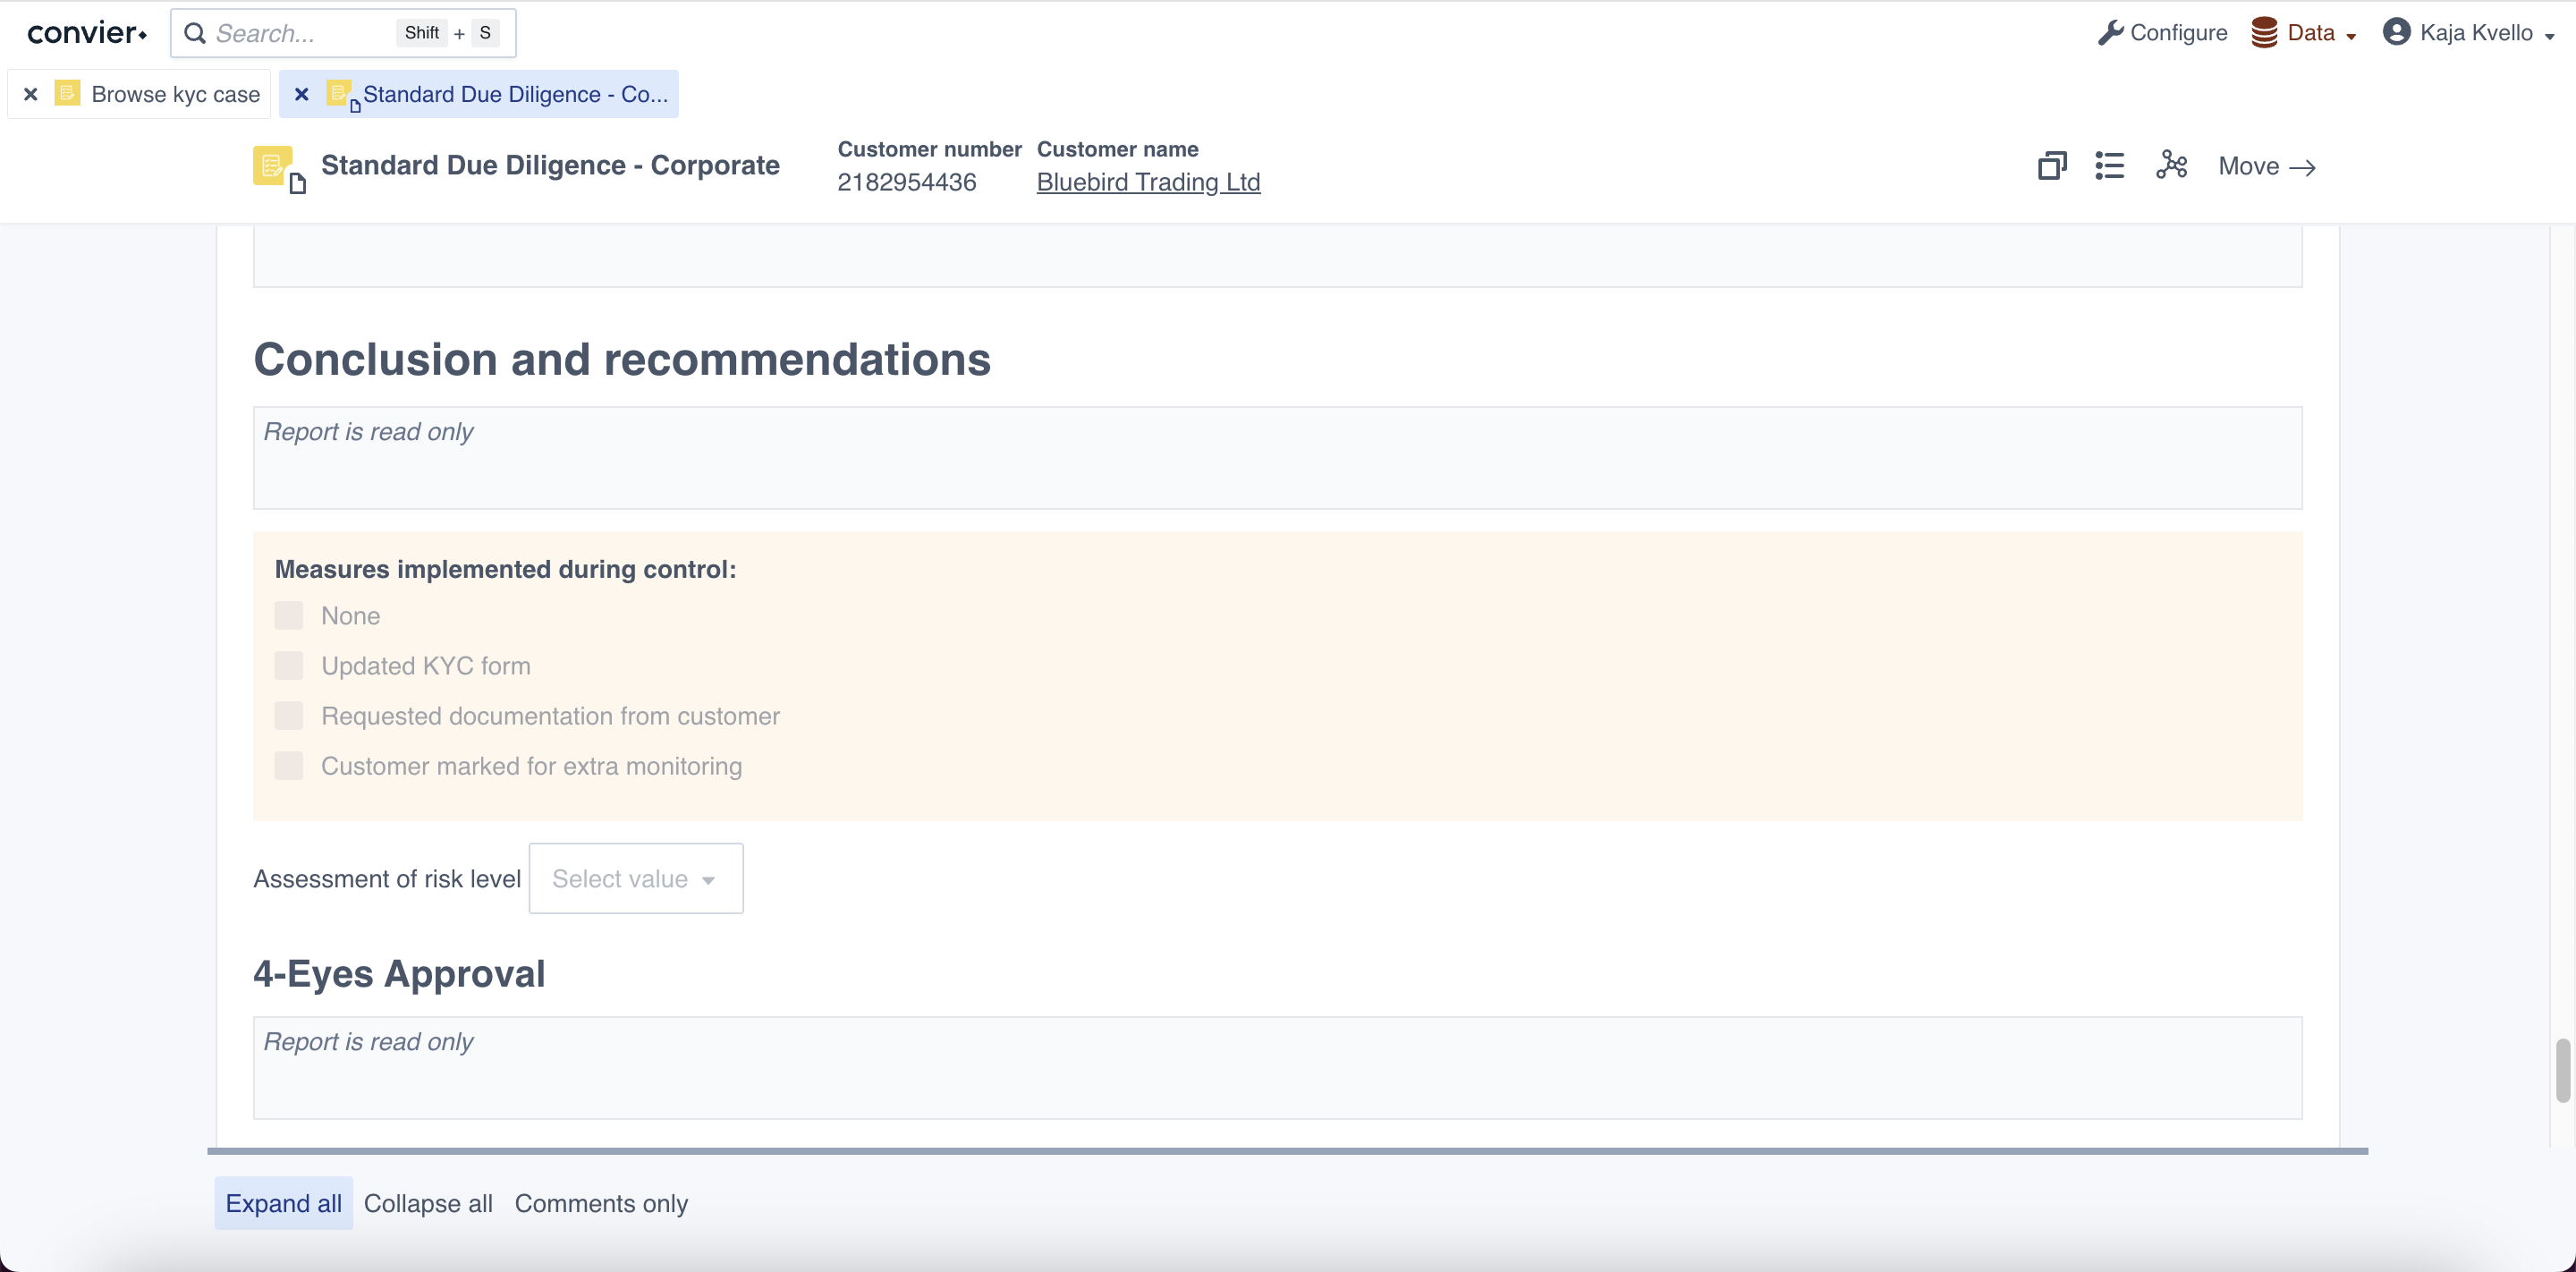 Example of a report in read-only mode
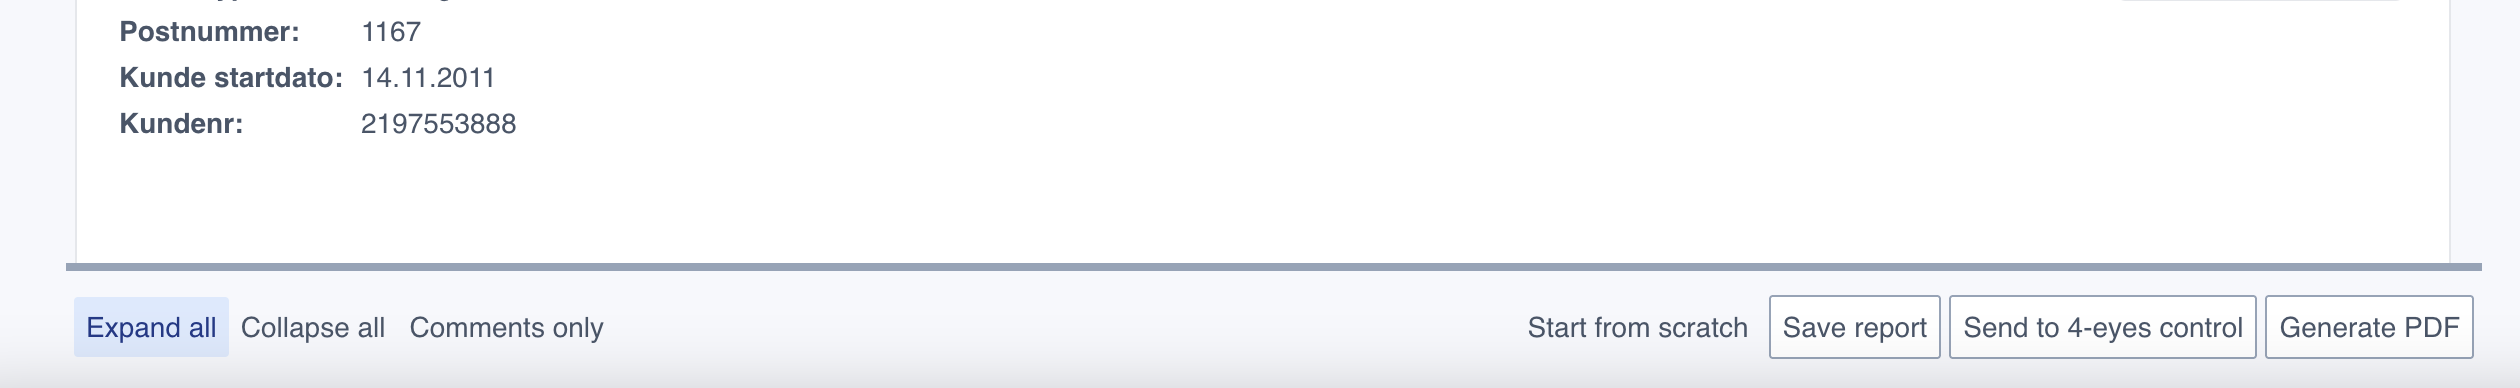
When reviewing a report it might be helpful to see only the most relevant report sections. This can be achieved by using the collapse functionality in the report view. There are 3 buttons in the bottom part of the report view which allows the user to select the desired view mode for the report.
 A report in “collapse all” view mode, with one section expanded. Click the arrows next to a section heading to expand/collapse
Report data is stored in the following way:
Working storage in the browser As a user is editing a report, the contents written in the input fields will be temporarilly stored in the user’s local browser. This means that if a report is closed and then re-opened by the same user, the contents written in the input fields will still be there. However, another user opening the same report will not see and content in the input fields. If the local browser data of the user is deleted (f.ex. due to an upgrade), the written report content will also be deleted. It is therefore advised to properly save a report before closing it.
Saving a report The “Save” button will store the current report to the report store configured for the project in question. The report store is usually a dedicated database for report data, but can also be a CRM system or other store location. When a report is stored, both the contents of the input fields and the loaded data is saved. This means that a stored report will load the report data with the values they had at the time the report was saved for the first time. The timestamp at the top of the report contains information about what time the report data is loaded from. Saved reports will not automatically update it’s data.
 The timestamp indicated the time for when the data in the report was loaded
File: Troubleshooting and support
You can get in touch with a Convier represenative via support@convier.com. Please reach out if you are experiencing an issue, need help with the product or have any feedback for us. We will get back to you as soon as we can!
Even though we wish to avoid them, errors might sometimes occur in the platform. In those cases, you will usually see an error message with some information about what went wrong. An example is shown below.
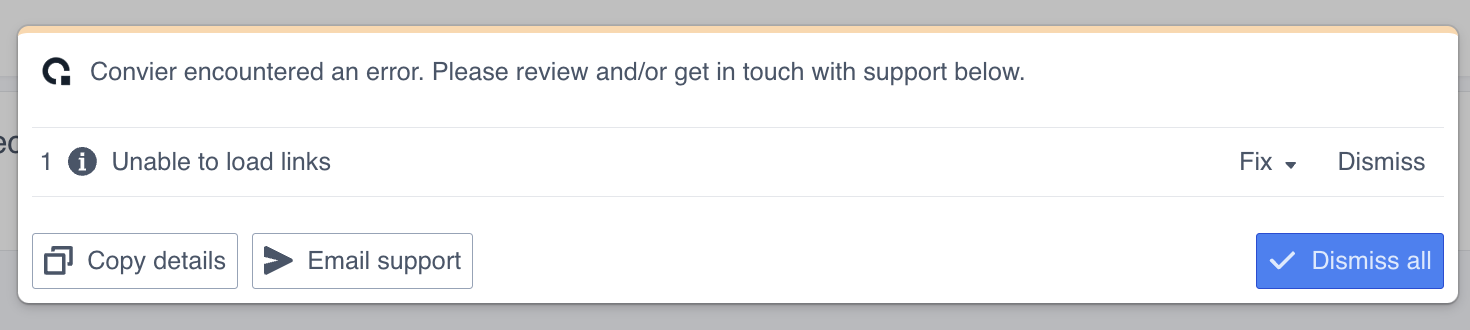
To get help with your issue, click the “Email support”-button to automatically generate an email which includes technical details about the error experienced. Alternatively, use the “Copy details” to copy the technical information to your clipboard and paste this in a message to a Convier representative.
Convier might sometimes experience connection issues with the connected data sources. This will be indicated by the “Status”-button (bottom left corner) turning orange.
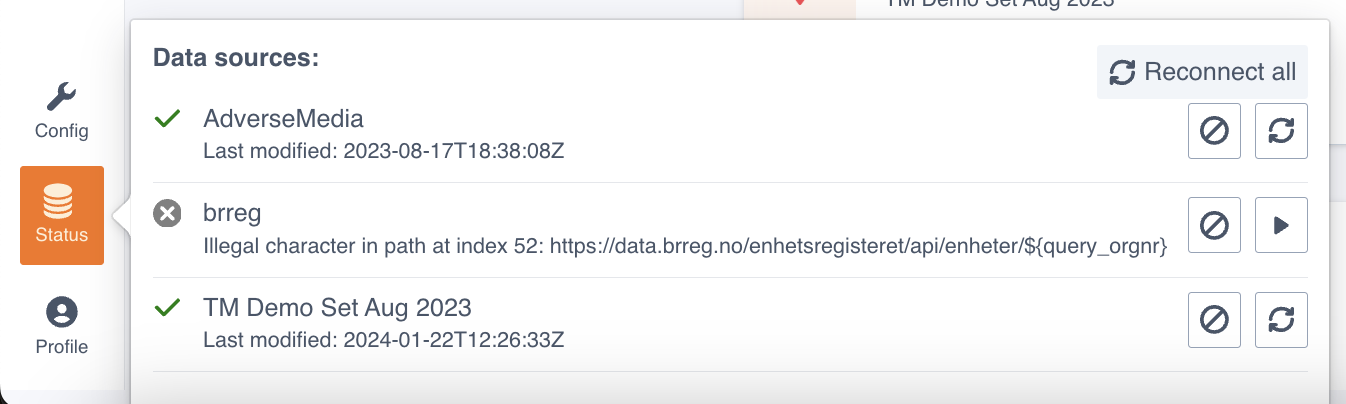 Example of connection to a source being lost. In this case the source “brreg” has lost connection.
To attempt a reconnect, click the “Status” button and then “Reconnect all” (top, right corner of the pop-out). You might also need to refresh the web page (F5 or Ctrl+R/Cmd+R) in order for the reconnect to take effect. If this does not fix the issue, please contact support.
File: User documentation