Analysing data
A guide to the data exploration tools in Convier, including browse views, filtering, sorting, grouping, and date range selection.
Convier has functionality for exploring and analysing data in different ways, depending on the usecase.
Inspect App
The Inspect app is a tool designed for deep dives into transaction analysis.
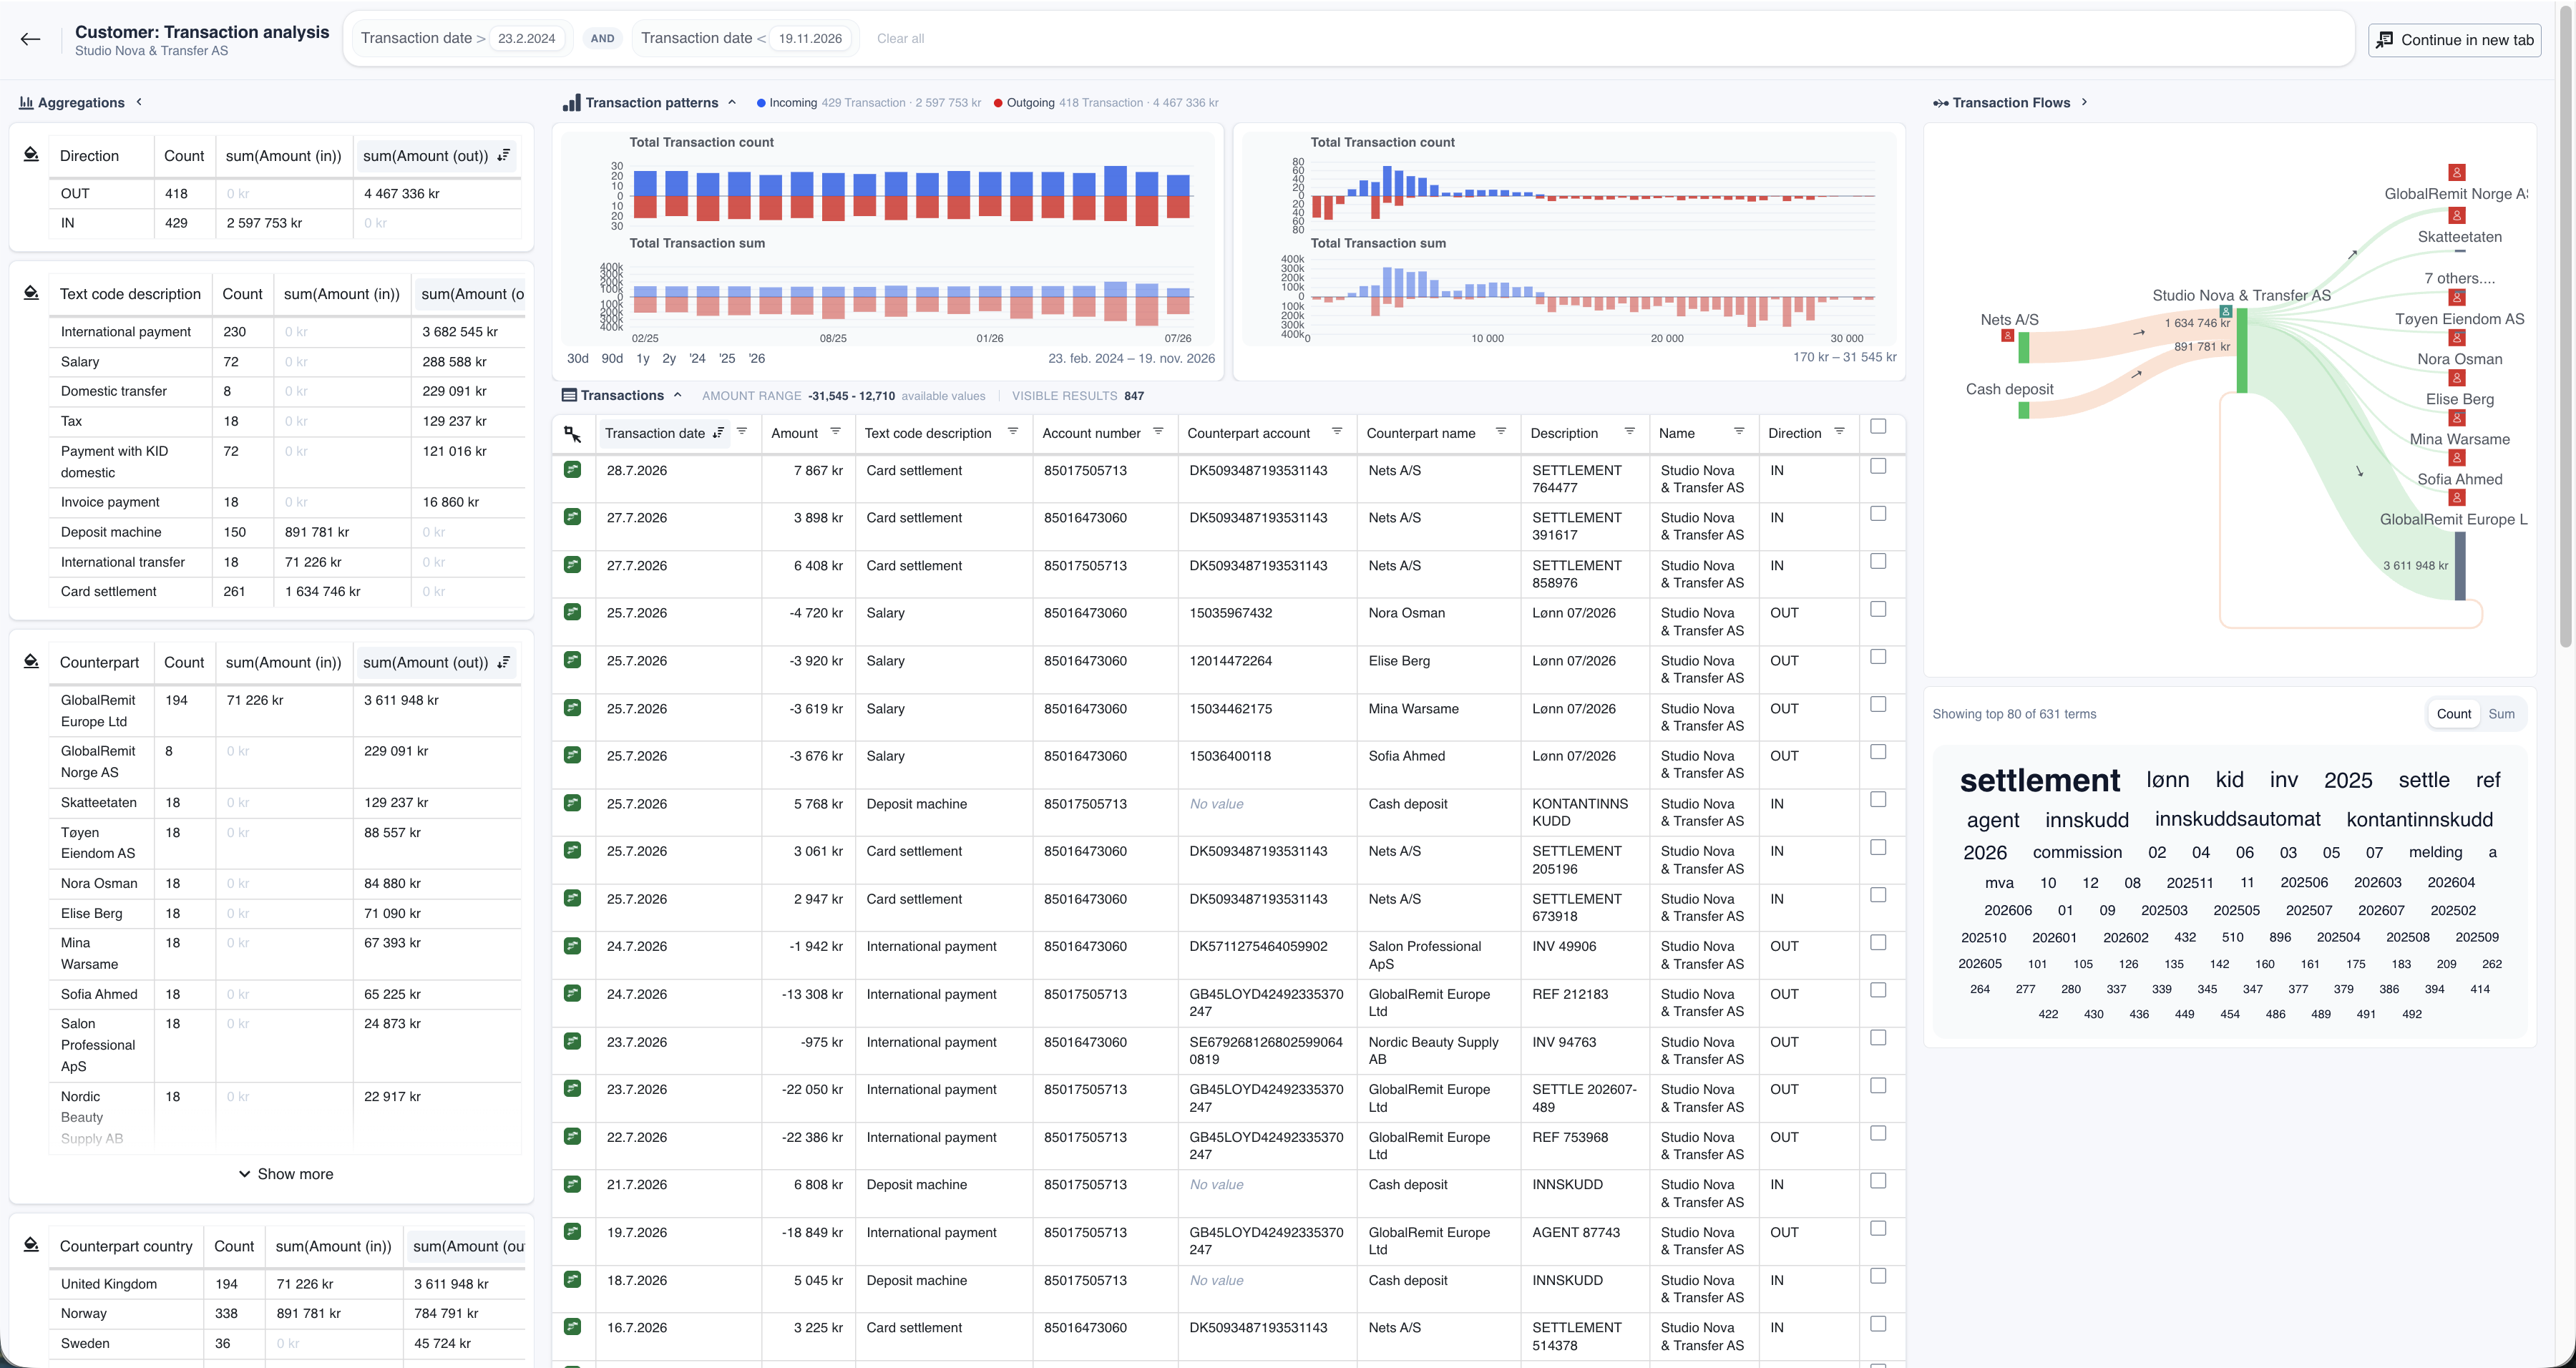
The complete view of the Inspect app
Overview
The Inspect app consists of the following main components:
- Filter bar: The filter bar extends across the top of the app and displays all active filters. These filters apply globally to all visualisations in the Inspect app.
- Aggregation charts: The left-hand side contains a set of customisable aggregation charts with filtering functionality.
- Histograms: Below the filter bar are two histograms showing the distribution of transactions over time and by transaction amount.
- Transaction table: The main table contains the individual transactions included in the current view.
- Sankey diagram: The diagram on the right-hand side shows cash flows between the selected customer and its counterparties.
- Word cloud: The word cloud shows terms found in the transaction free-text field.
Filter bar

The Inspect app currently shows transactions dated after 24.11.2023 and before 20.08.2026, with amounts above 10 000 kr.
The filter bar shows all filters currently applied to the data in the Inspect app. To remove an individual filter, click its “×”. To remove all filters, click “Clear all”.
Aggregation Charts
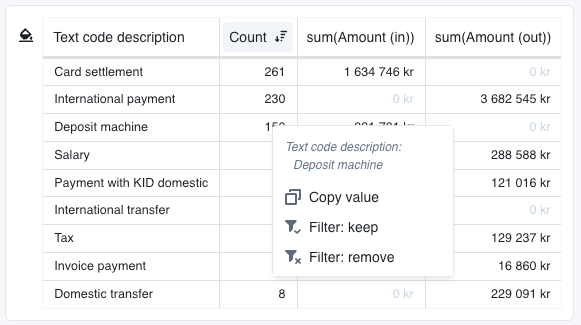
Aggregation charts can be sorted in ascending or descending order by any column. Select a row to apply its category as a global filter to all transactions.
Histograms
The histograms show:
-
The distribution of transaction count and total amount over time to the left
-
The distribution of transaction count and total amount by transaction amount to the right
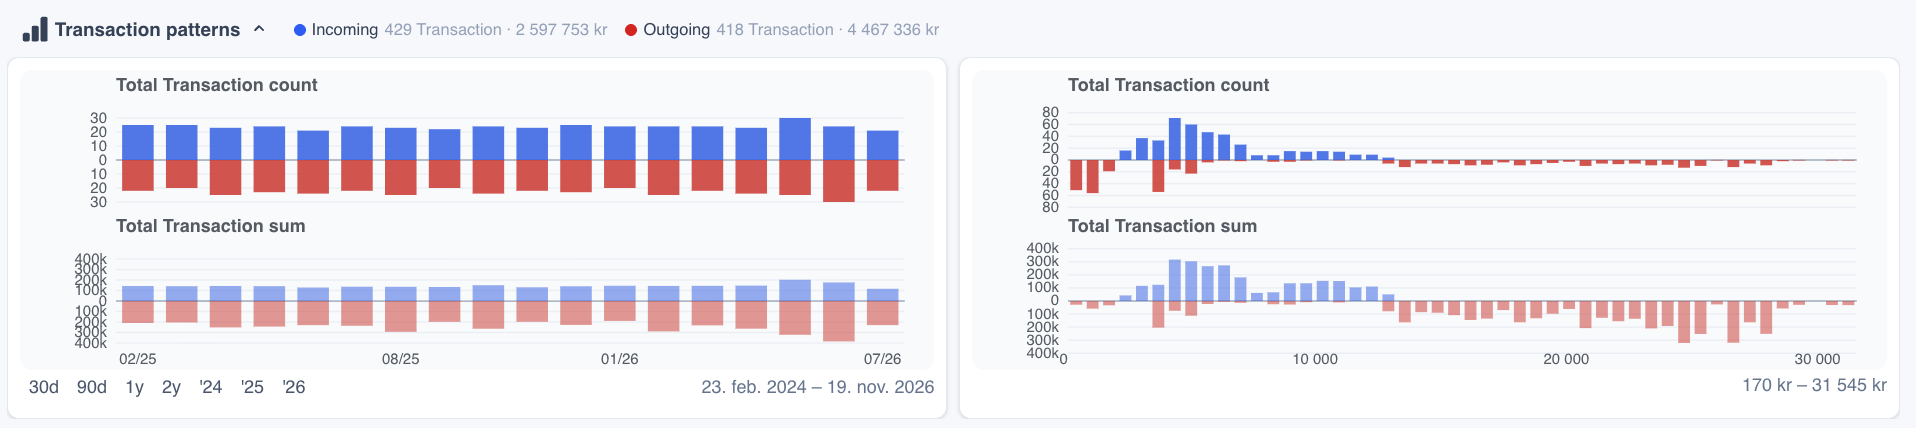
The histogram may be used for filtering in three ways
- Clicking on any of the quick filters "30d", "1y" etc.
- Clicking on any single column inside the histogram
- Clicking, holding and dragging your mouse to highlight a section of the histogram
All these operations will apply a global filter to the entire Inspect App.
Transaction table
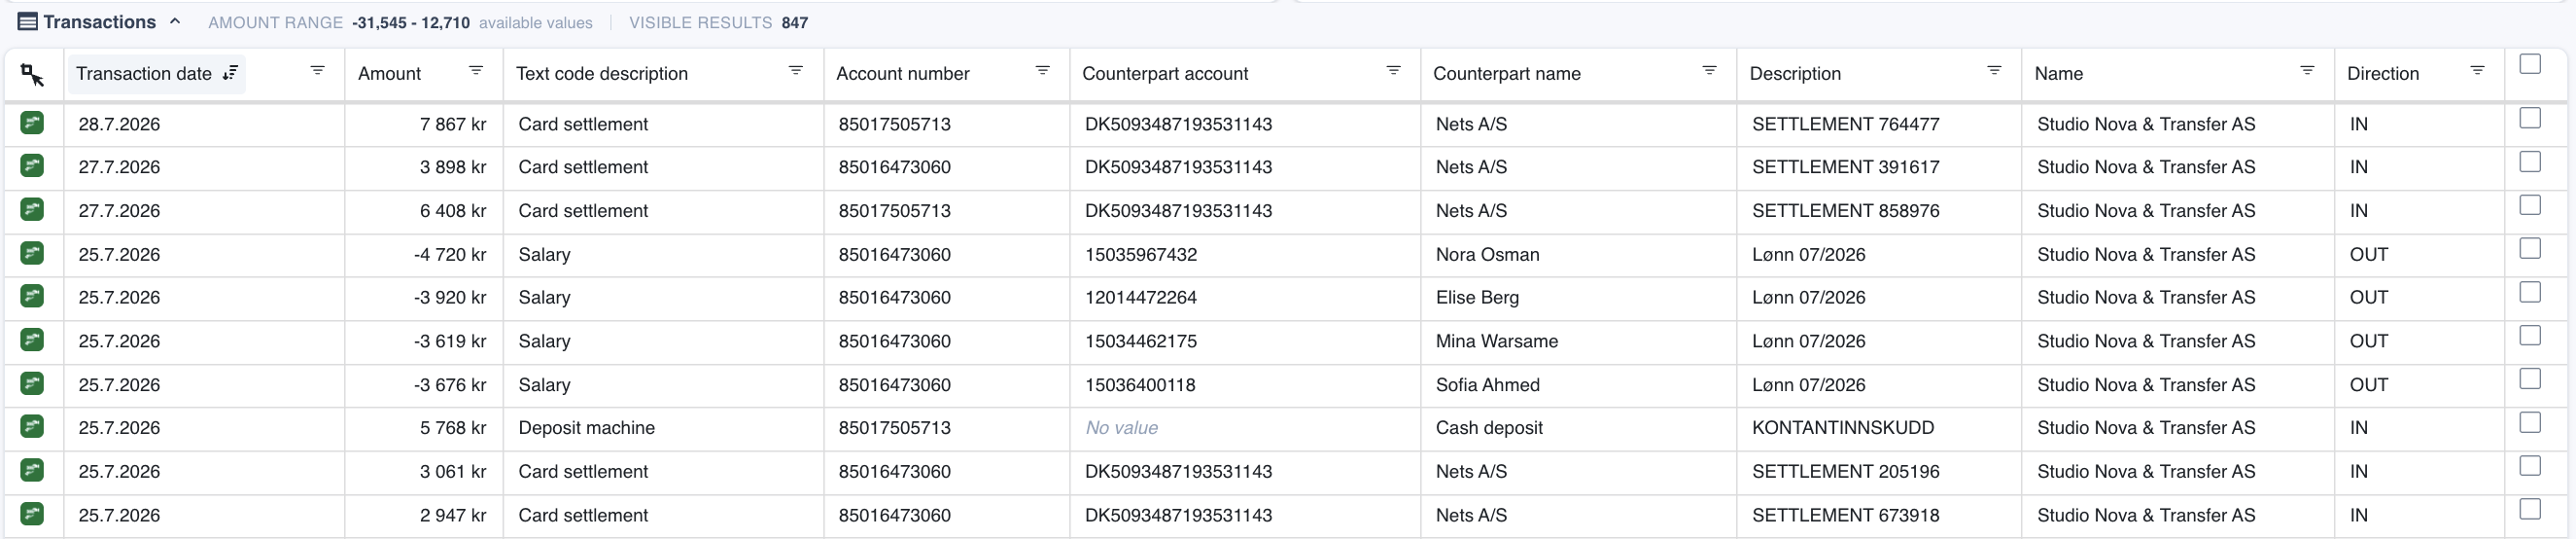
The transaction table is the main table of the Inspect app and contains a lot of built-in functionality.
Sorting data
To sort the table, select the header of the column you want to sort by. Click it once to sort the data in ascending order and a second time to sort it in descending order. The sorting icon indicates the active sorting column and direction.
Filtering data
To filter the transaction table, select the Filter button in the relevant column. The filter menu provides several ways to filter the data. Add the desired filters and select “Apply” to display the matching transactions. To remove the filter from a column, select “Clear” in the filter menu.
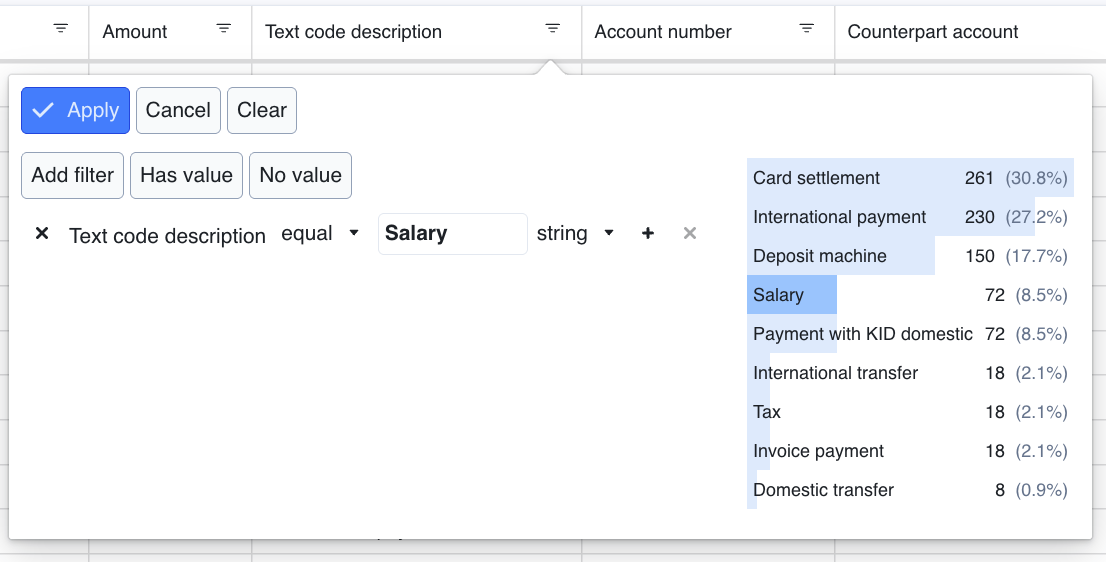
Filter about to be applied on the column “Text Code Description”, showing only transactions with category “Salary”
The options in the filter menu have the following effects:
- Add filter: Compares the value in the selected column with a specified filter value. You can change the comparison type, for example from “equals” to “not equal.” Select the “+” button beside the filter to add more filter values. You can also select values from the list on the right to add them quickly.
- Has value: Displays only rows in which the selected column contains a value.
- No value: Displays only rows in which the selected column is empty.
Selecting rows
Select individual rows in the transaction table by clicking them. To select multiple adjacent rows, click and drag the pointer across them.

An orange-outlined summary box shows the number of selected rows and the total incoming and outgoing amounts for those transactions.
Copy objects copies the selected transactions so that you can paste them elsewhere, such as into a text field in an EDD report. Clear selection clears the current row selection without deleting any data.
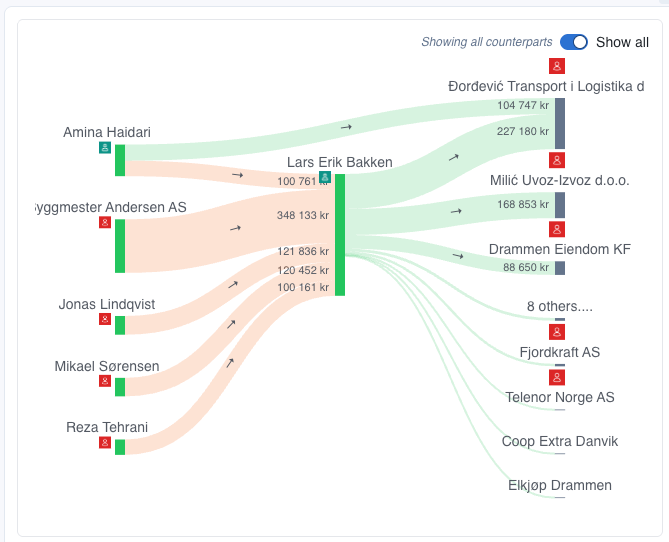
Sanky diagram
The Sanky diagram is collapsed by default. To expand it, click the arrow in the upper-left corner.
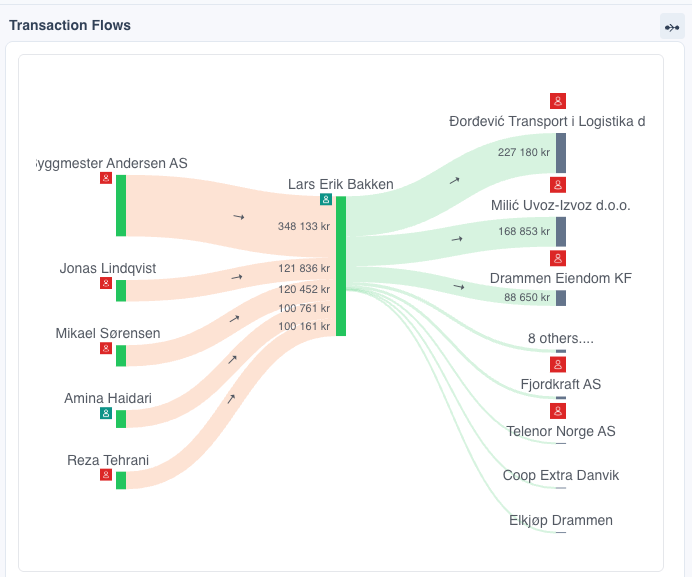
The diagram shows incoming and outgoing cash flows between the selected entity and its counterparties. Wider connecting lines represent larger amounts.
Network Analysis
You can conduct network analysis by selecting a counterparty node and adding it to the analysis.
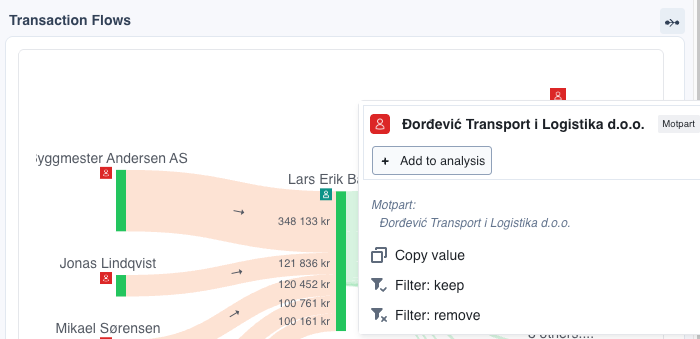
Doing so will show all transaction flows the parties (the customer and counterparty in this case) have in common.
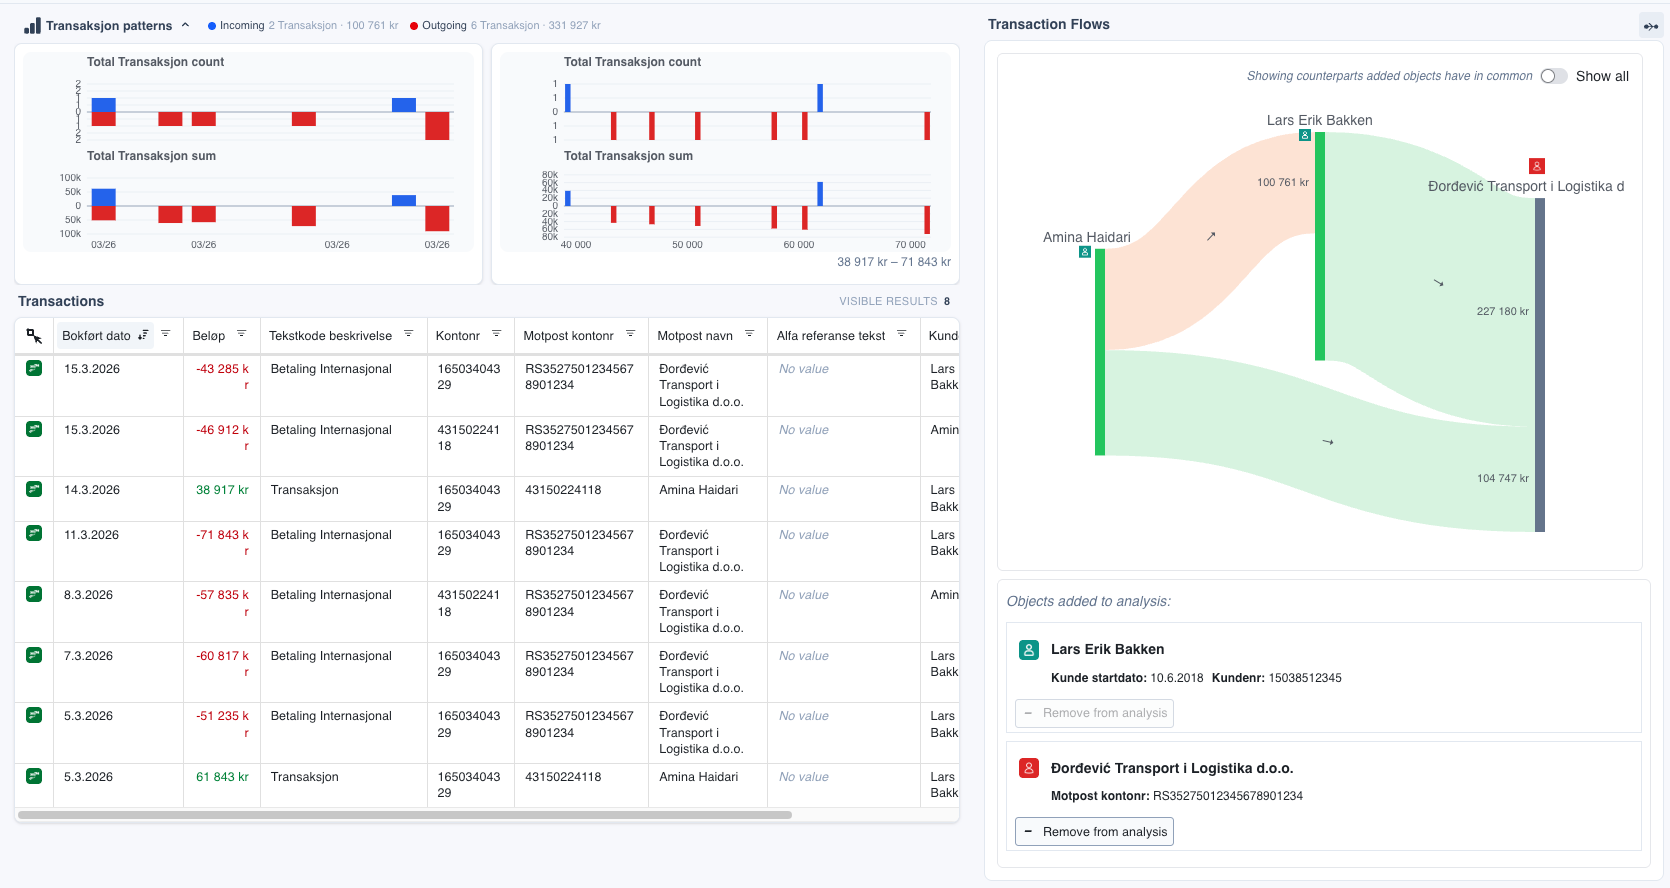
You can view all transaction flows belonging to both the customer and counterparty combined by toggling the button in the upper right hand corner of the Sanky diagram.
Word cloud
The word cloud is collapsed by default. To expand it, click the arrow in the upper-left corner.
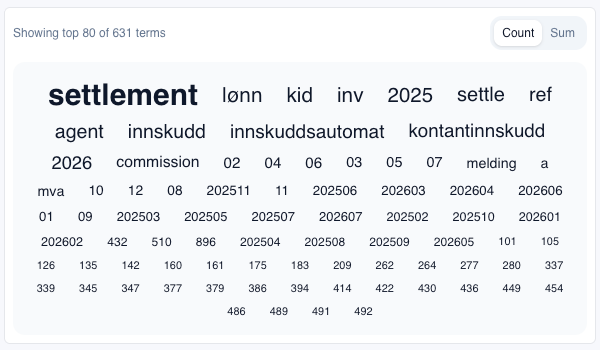
The word cloud shows terms found in the transaction free-text field. In Count view, larger terms appear more frequently. In Sum view, larger terms are associated with a higher total transaction amount.
Select a word to apply it as a global filter in the Inspect app.
Select date range for data views
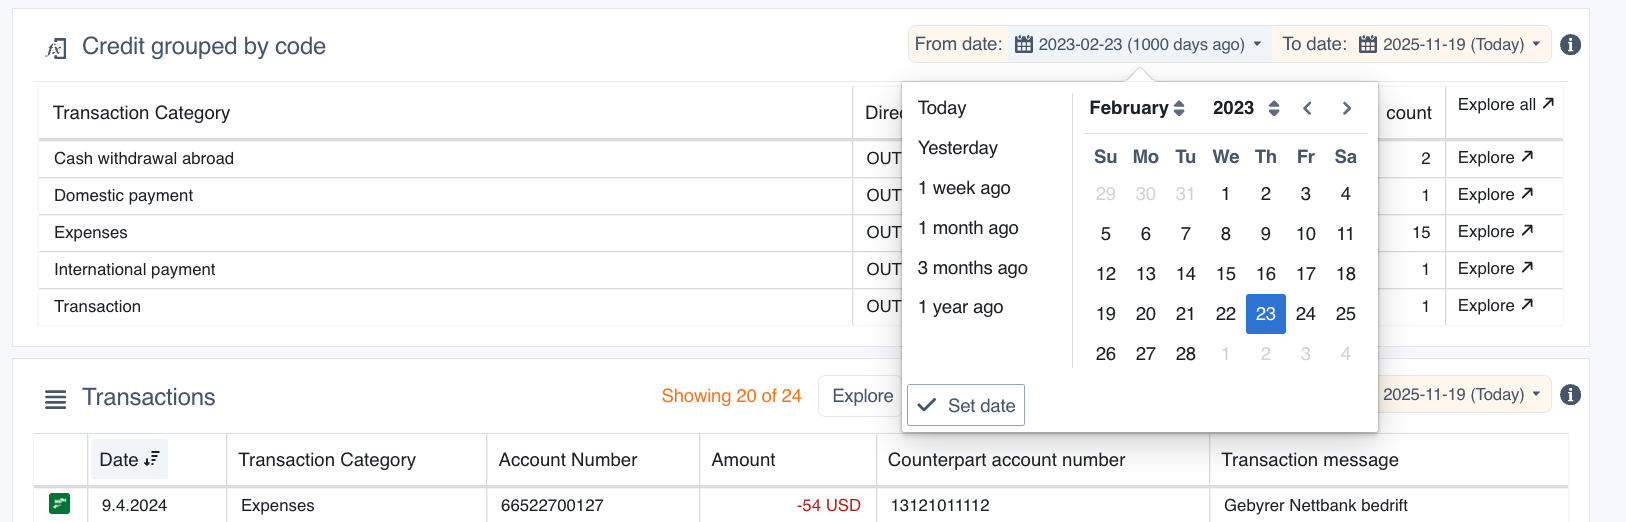
Certain charts and browse views in Convier will contain a date selector indicating the time range of the data it contains. Change the time range of loaded data by selecting a new date for the “from/to date” field. Note that changing the date in one chart or view will affect the selected date range in other views in the platform.
Browse data
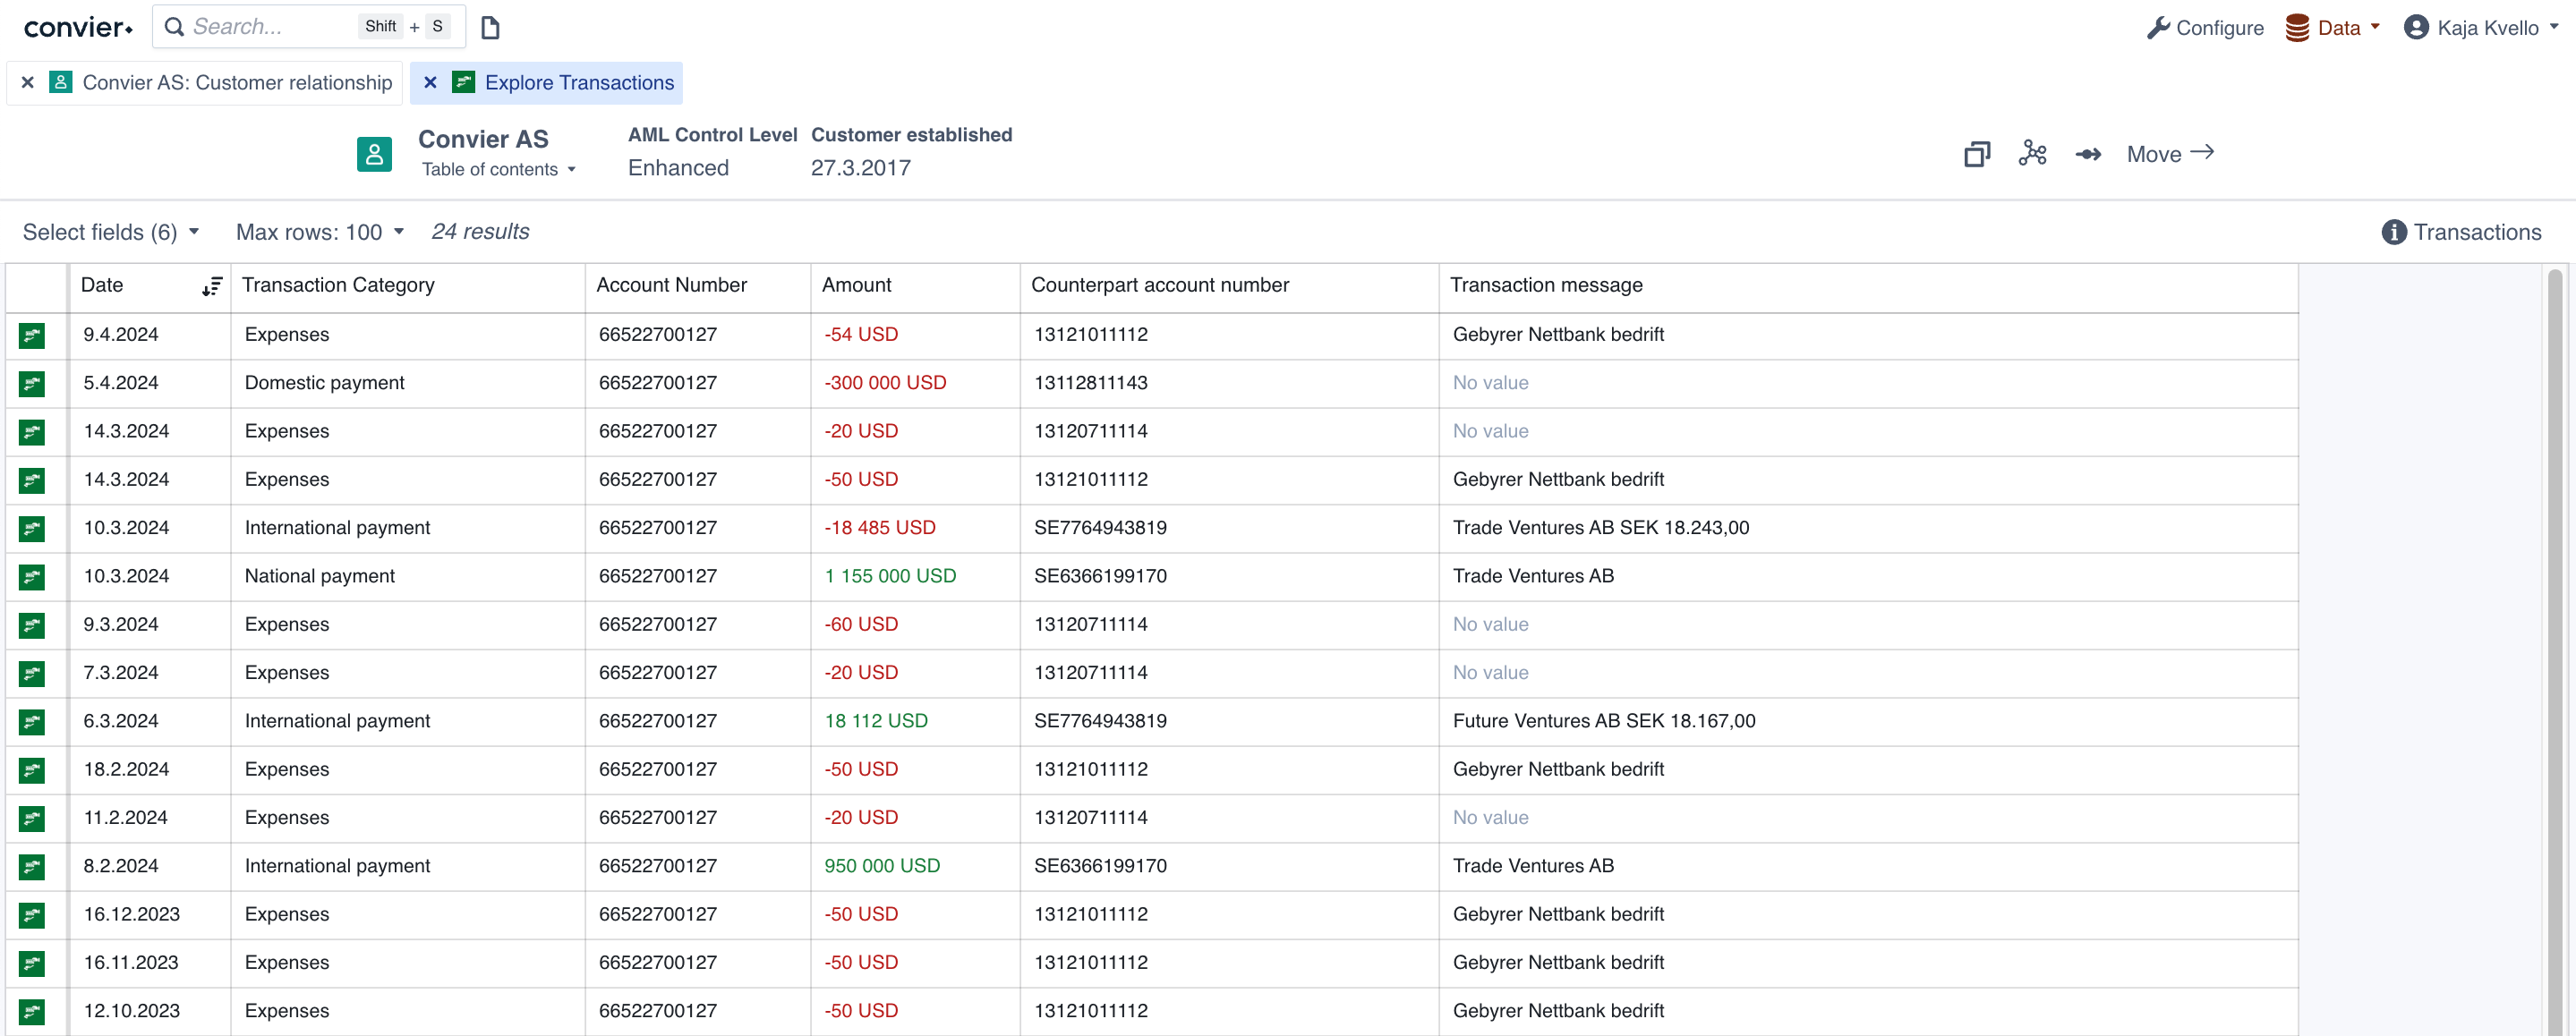
Browse is a functionality which allows you to explore, filter and sort data in a table view. You can select what data to view in Browse mode by clicking the “Explore” buttons of a chart that contains the data you wish to analyse.
Browse view
Choose values and data size
The top bar of the Browse view contains options for what, and how much, data to load into the Browse view. “Max rows” decides the maximum number of rows to load in from the data source. Be advised that loading a large number of rows might be slow. The top bar will also contain information about how many rows have been loaded into the current view.
“Select fields” allow selecting or un-selecting the columns displayed in the view.
Sorting data
Data in a table can be sorted by clicking the column header of the column you want to sort by. Clicking once will sort the data in ascending direction, clicking twice will sort in a descending direction. The sorting icon indicates which direction and column the table is currently sorted by.
Filtering data
To filter the data in the Browse view, click the “Filter”-button in the column you wish to filter by. The filter dropdown will give several options for how to filter the table data. Add the desired filter(s) and click “Apply” to display the resulting rows in the Browse view. Columns with an active filter will be highlighted in yellow. To clear the filter in a column, click “Clear” in the filter dropdown.
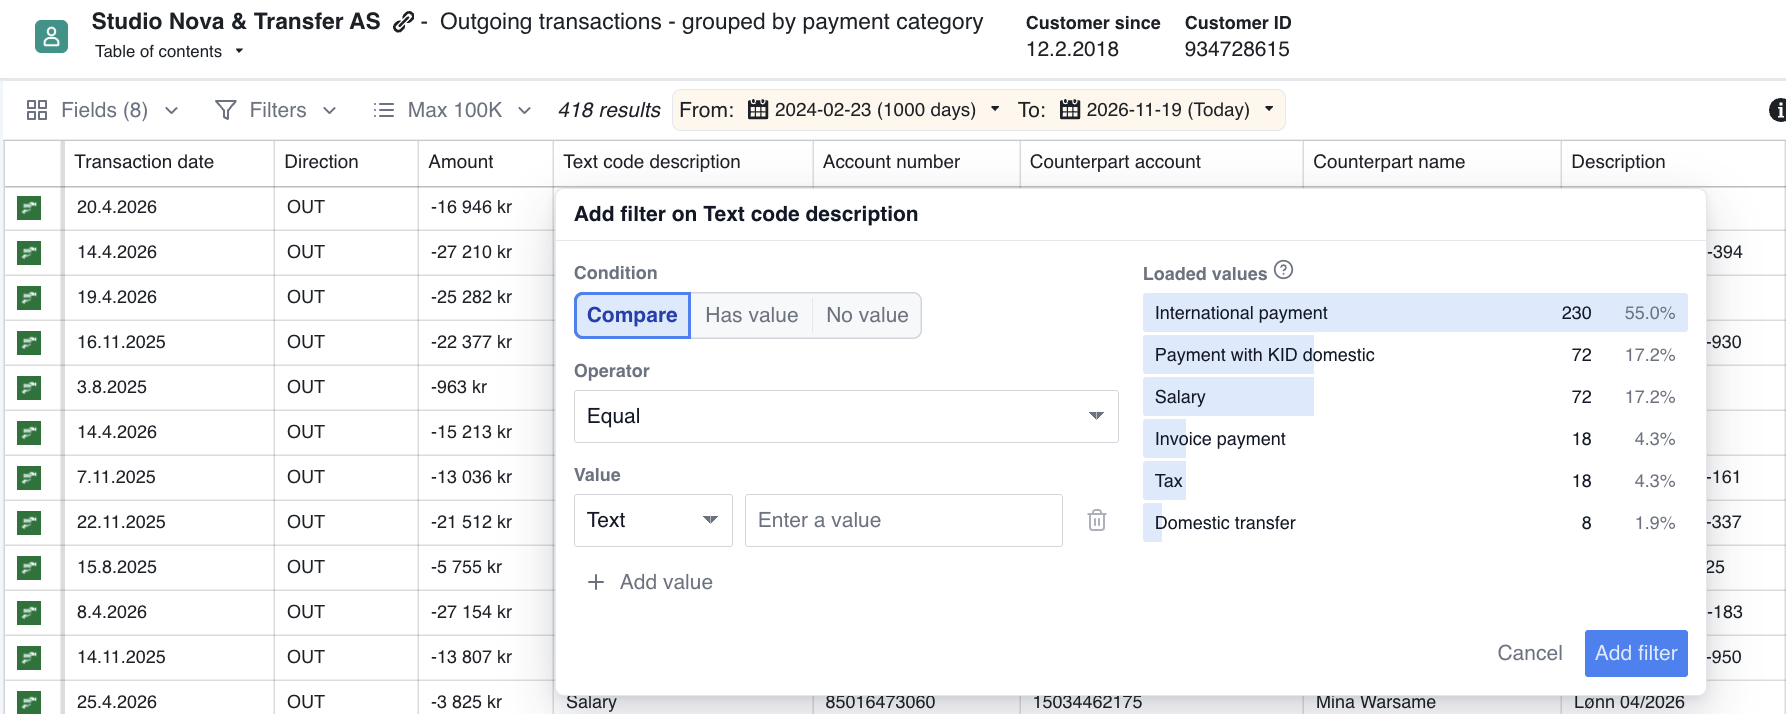
Filter about to be applied on the column “Transaction Category”, showing only transactions with category “Cash withdrawal abroad” or “International payment”
The buttons in the filter menu have the following effects:
-
"Add filter" will add your current filter to the list of configured filters for this column
-
"Apply" will save your filter and apply it to the data showing in the table
Group data
It is also possible to group data by a specific column, similar to how a pivot table works in Excel. To group the data, select “Group by” on the column value you want to group by. It is possible to select “Group by” on several columns to further divide into subgroups. To add sums of values in the grouping table, select “Sum” on the column you want to add the sum of. To see only the rows included in one group, use the Explore-button (arrow) on the desired group row. This will filter the Browse view to only include rows in the given group.
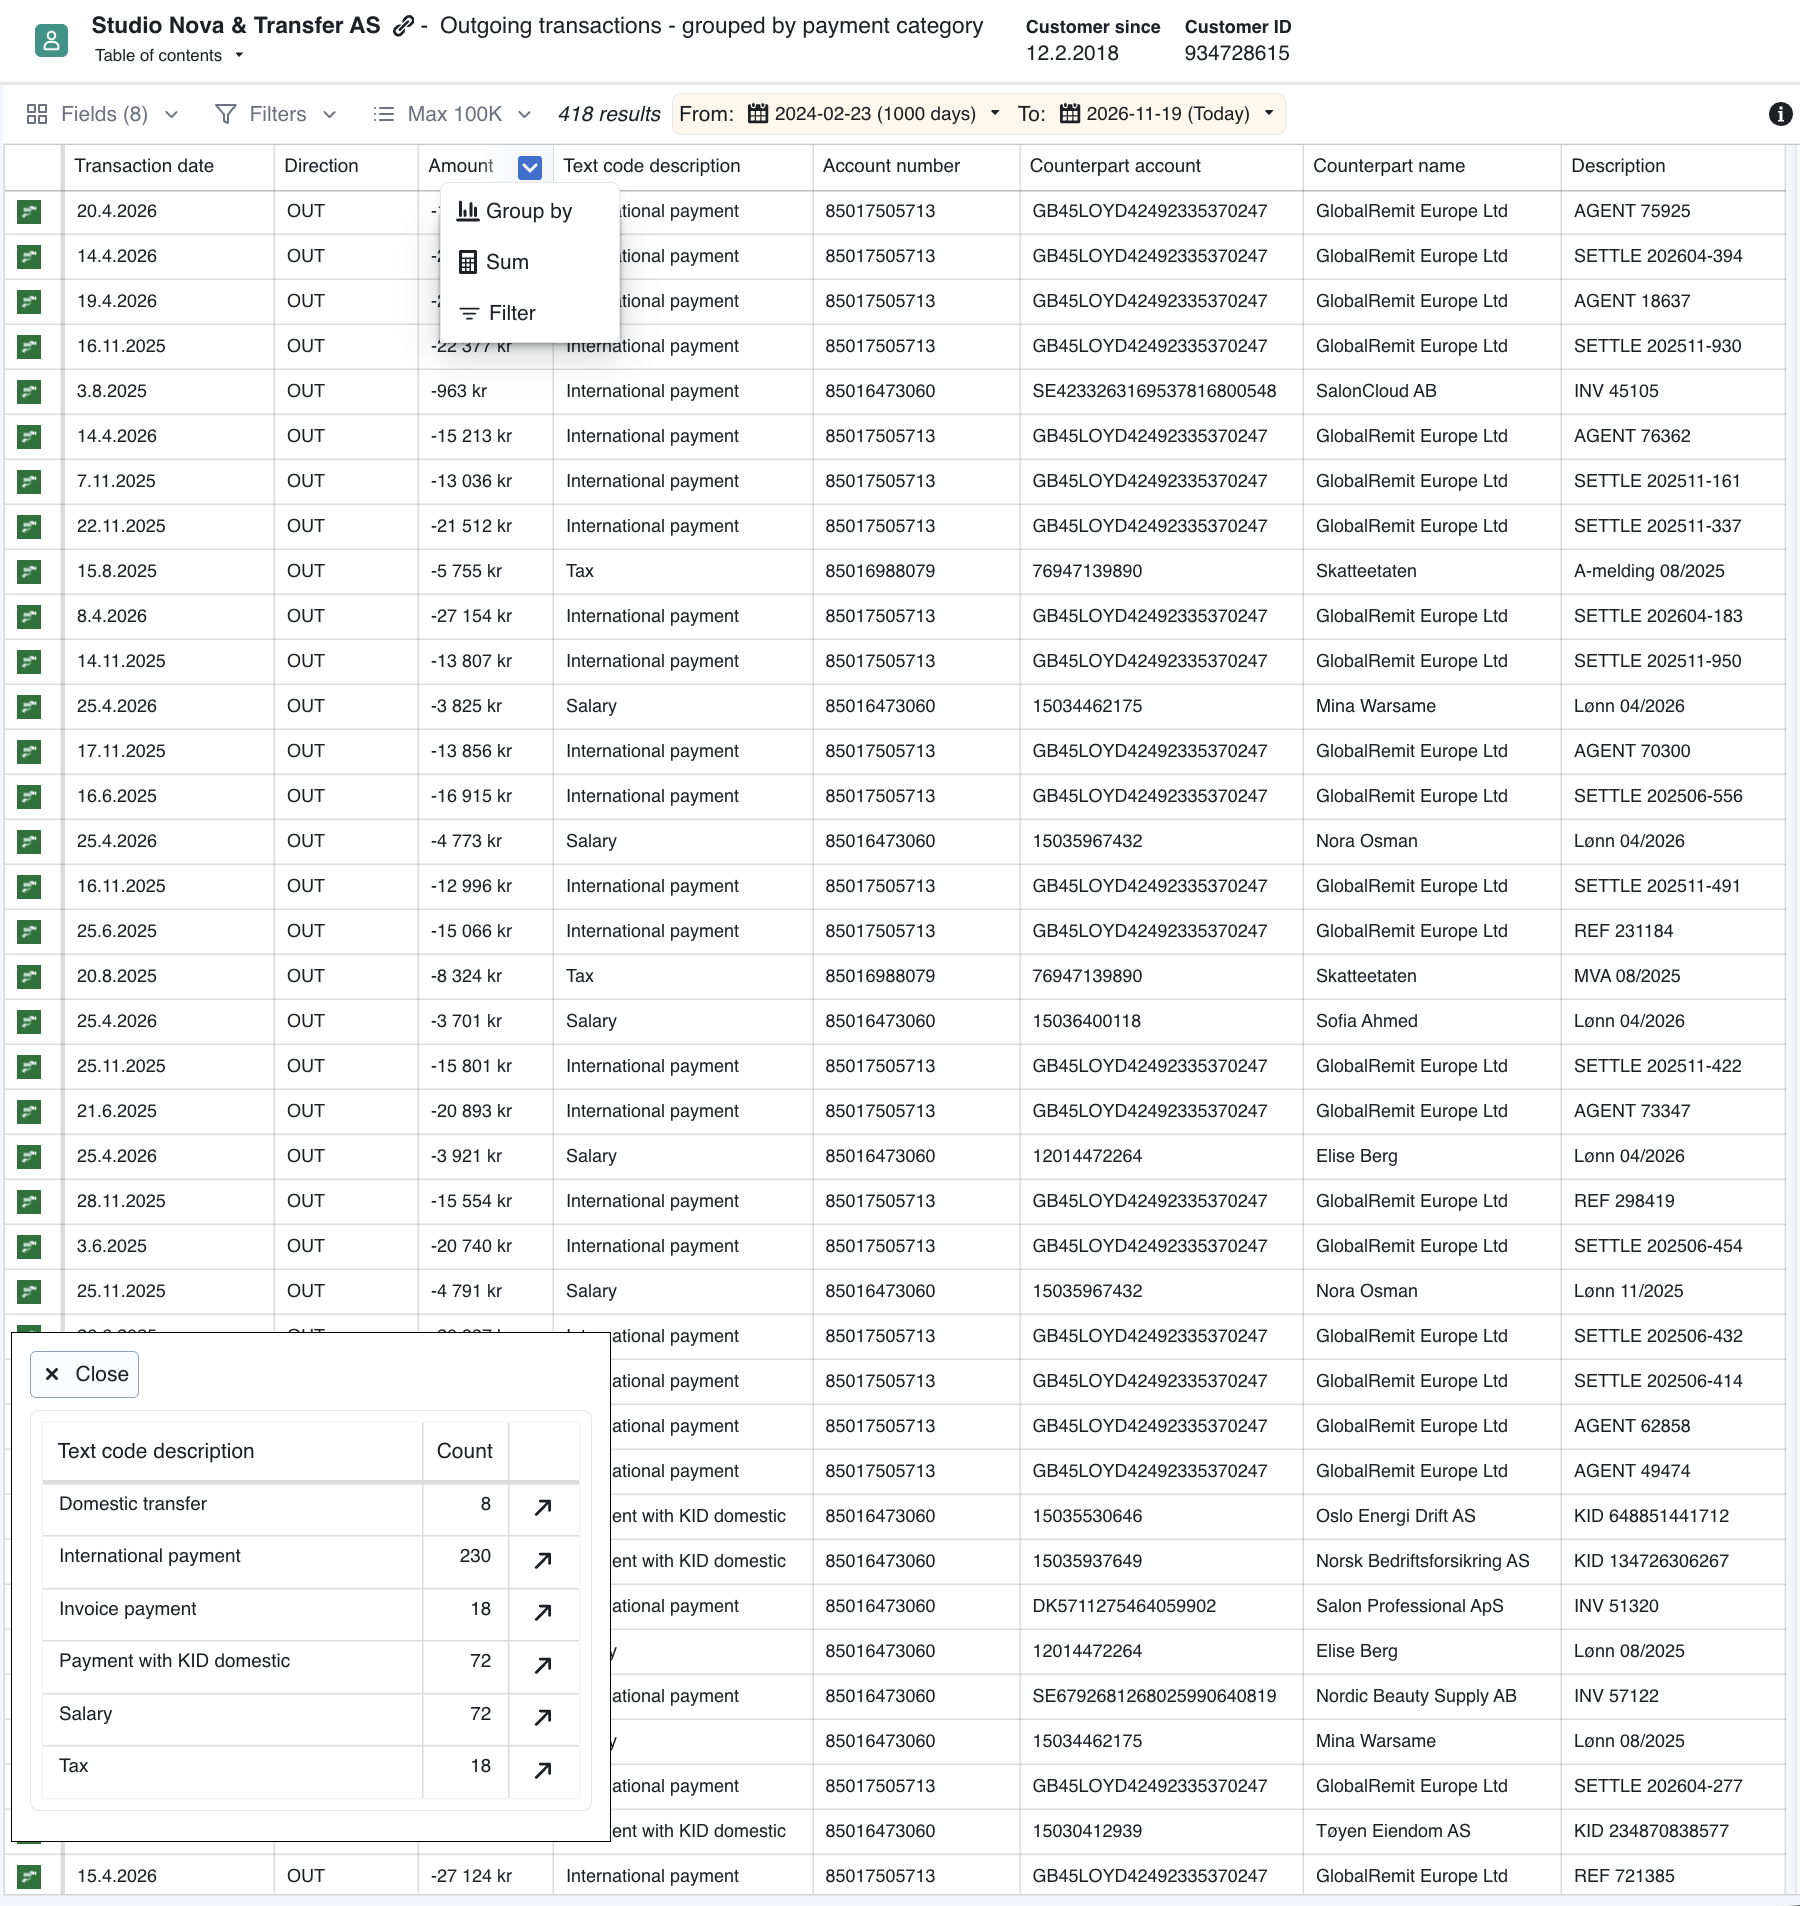
A transaction list grouped by "Counterpart account number", with a sum of "Amount" added to the table
Last updated on